|
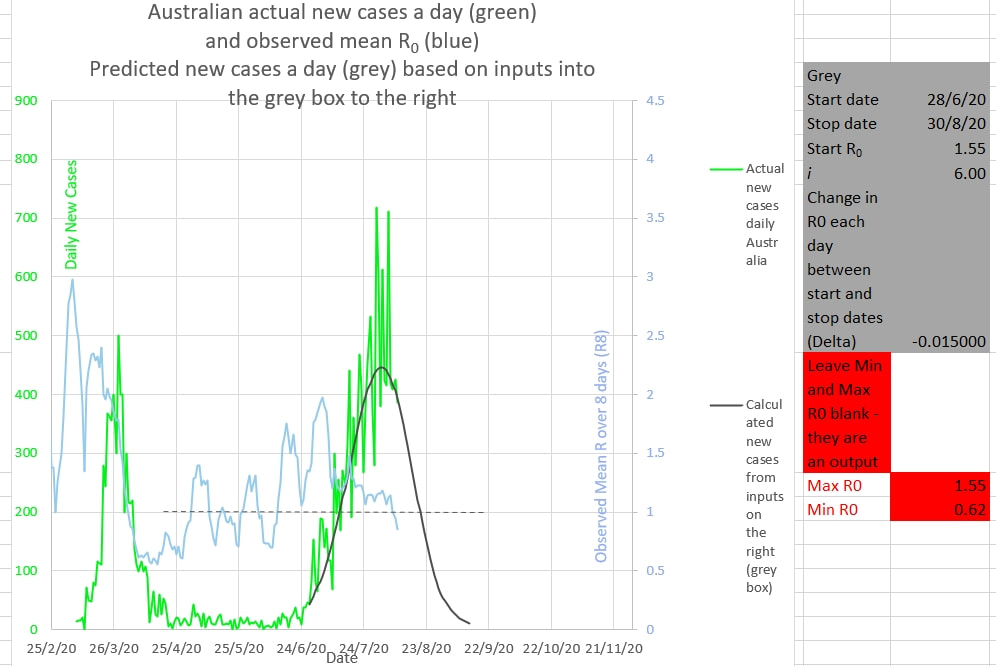
Victoria has probably got the outbreak licked. The mean R calculated over 8 days (R8) is now under 1.0 and falling (light blue). Hopefully the actual Australian New Cases per day (green) will follow the grey graph which predicts the daily new cases if the R follows the values input in the grey box to the right. That is that the R should start at 1.55 on the 28 June (where it actually was) and then fall by 0.015 a day until 30 August. R had been falling at that rate in late June, and with better policing of restrictions R is now falling by at least that rate. So, the cluster (second wave?) may be down to single digit figure new cases by mid-September. An R increasing over 1.0 appears to be a good early warning of the start of a cluster. Waiting for the numbers to increase so that the cluster can be perceived is probably waiting too long. In preventive Medicine 'nothing happened' is a good outcome, not a cause for criticism.
0 Comments
Leave a Reply. |
AuthorDr Michael Cole FRACP LLB Archives
September 2021
Categories |

 RSS Feed