|
There are good economic and psychological reasons for easing restrictions whenever possible. The problem is in deciding if and when it is possible. After the first wave Australia lifted restrictions on 1 May 2020, just when the R was near 1 and climbing. In retrospect (or predictably, since an R over 1 means an epidemic is under way) it may have not been the best time to ease restrictions as much as they did. The blue arrow in the chart below. Now Victoria is lifting restrictions while the R is above 0.8 and not definitely falling. It may be a time for caution. A low number of cases each day is not a good sign. It means the R is at or near 1 and a third wave is possible. To be a good sign the daily cases must be low AND falling. That means the new cases a day has to aim to drop to zero (for community transmission). Cautious lifting of restrictions so that R is kept at below 1 in the whole population is probably a reasonable approach. 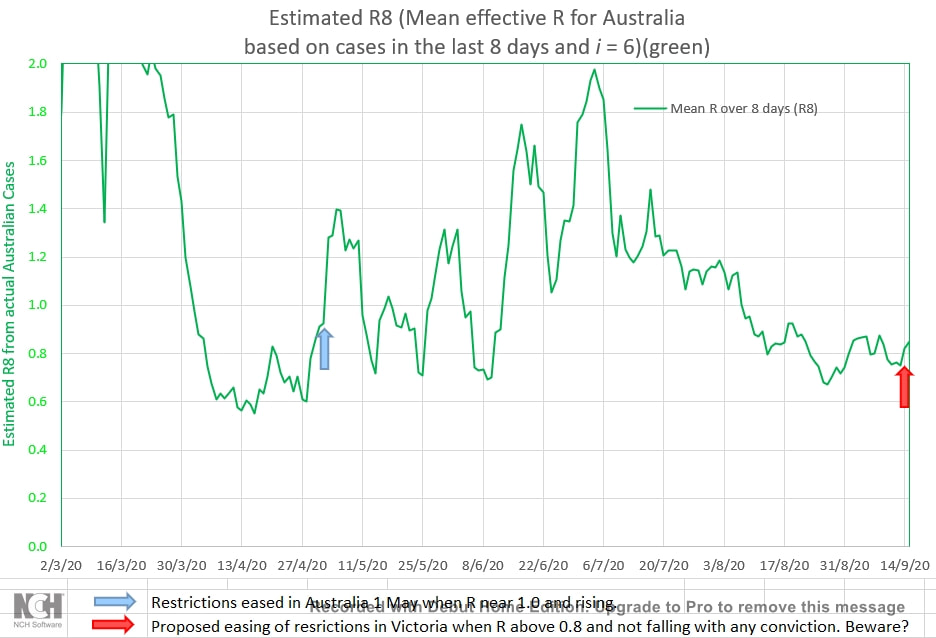
0 Comments
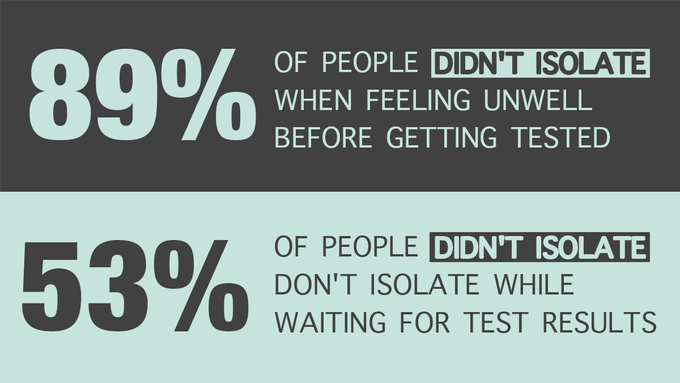 Astonishing. The non-compliance with restrictions and sound medical advice. But predictable from the the mean infection ratio over 8 days (R8) in Australia during the second wave. The reduction in R has been slow compared to the reduction in R during the first wave. See the chart below. And the R has actually climbed at times during the second wave, demonstrating a complete disregard for the restrictions and other people's health by a small number of the population. 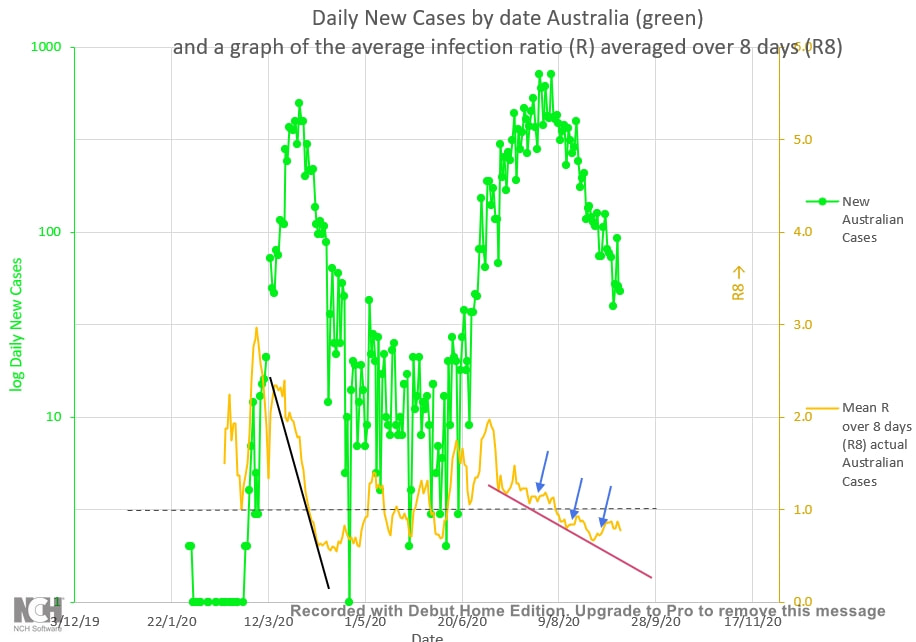 Compliance Fatigue or increasing distrust of authority may well explain the recurrent recent period where the average R (infection rate) for Australia has actually gone up instead of down (orange curve below). When the number of new cases is low that probably represents the behaviour or views of a small number in the population. But it represents a risk because those very individuals may be networked to other similar individuals, making an easy path of 'least resistance' for viral spread. Perhaps (human) behavioural science could suggest ways in which compliance and trust could be improved and fatigue reduced. 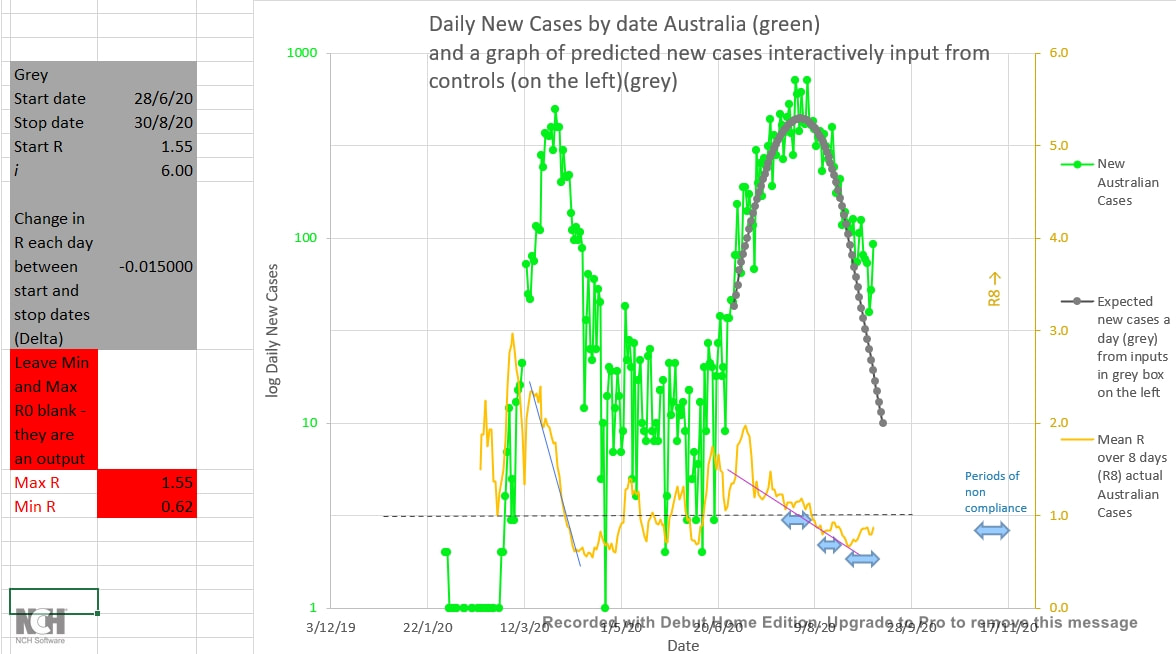 Human Behaviour probably also accounts for the fact that the R8 (apparent average infection rate averaged over 8 days) fell faster in the first wave than the second wave, and fell cleanly in the first wave but often unfortunately rose again in the second wave. (The orange curve above, and the green curve below.) If everyone was 'on board' and compliant as soon as restriction were put in place, the R or R8 should fall immediately and rapidly. Instead R or R8 falls over a number of days, probably indicating that more individuals become adequately compliant over time. Maybe there is a learning curve or a necessary preparation time or a peer effect (a greater pressure to do what others are doing). 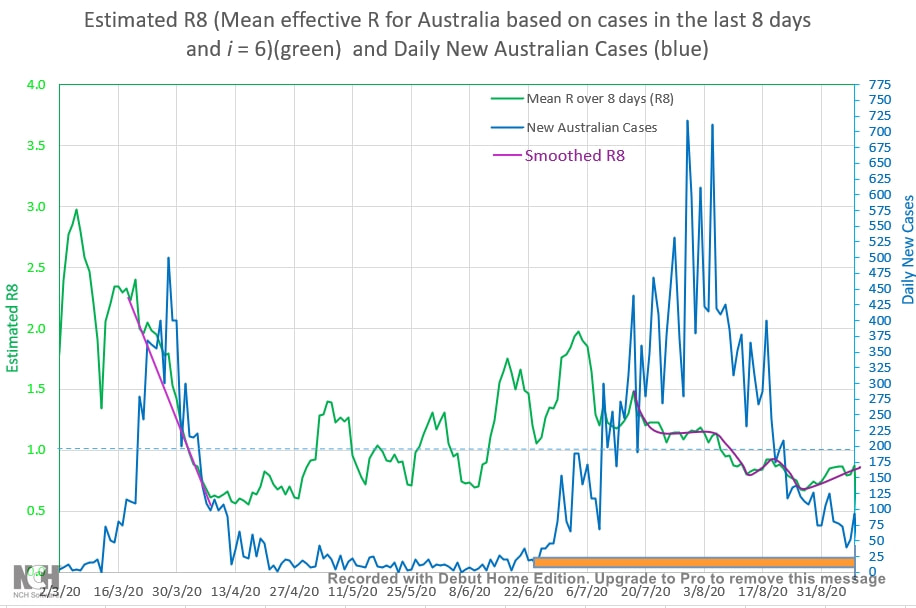 The earlier prediction that Australia would be down to single digit new cases a day by mid-September was based on the inputs shown in the grey box to the right of the chart below. The inputs were based on the shape of the curve of new Australian cases a day (green curve below) during the early part of the second wave. The R was expected to start at 1.55 on 28 June 2020 and decrease by 0.015 a day until 30 August (the purple line or curve below). The earlier prediction was fairly accurate except that the R did not fall steadily as expected, but often rebounded again and is nor rising towards 1 (a definite risk of another cluster or wave; the purple arrow versus the blue arrow). 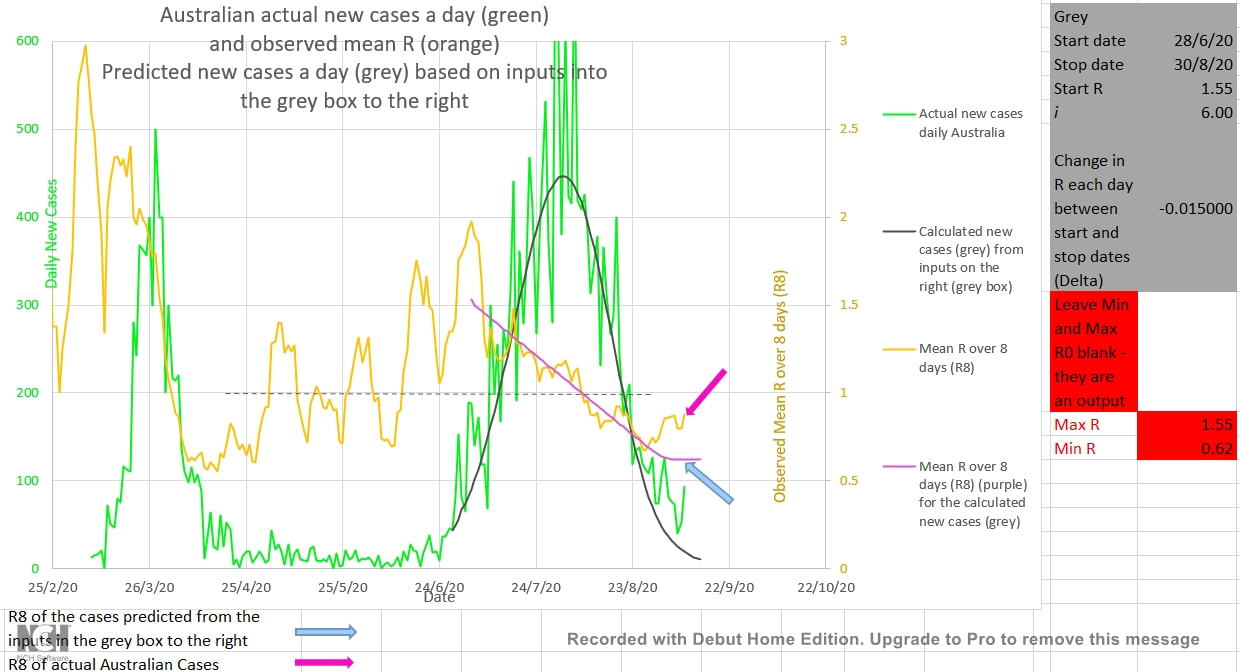 Various coloured curves (below) were fitted to the actual Australian new cases a day (green curve) at different periods during the second wave. Early on an R of 1.5 in the mathematical infection model matched the actual cases (brown curve). Later the pink curve, plotted from inputs in the pink box to the left of the chart, with an input for R of 1.25 matched the actual cases. As the second wave began to come under control an R of 0.87 generated a blue curve which best fitted the actual cases and finally, now, it appears that an R of 0.75 (the yellow curve) best fits the current Australian cases. The earlier prediction seems increasingly unlikely, but a least the cases will continue to fall as long as the R does not continue to rise. The way forward may lie in social behavioural science. 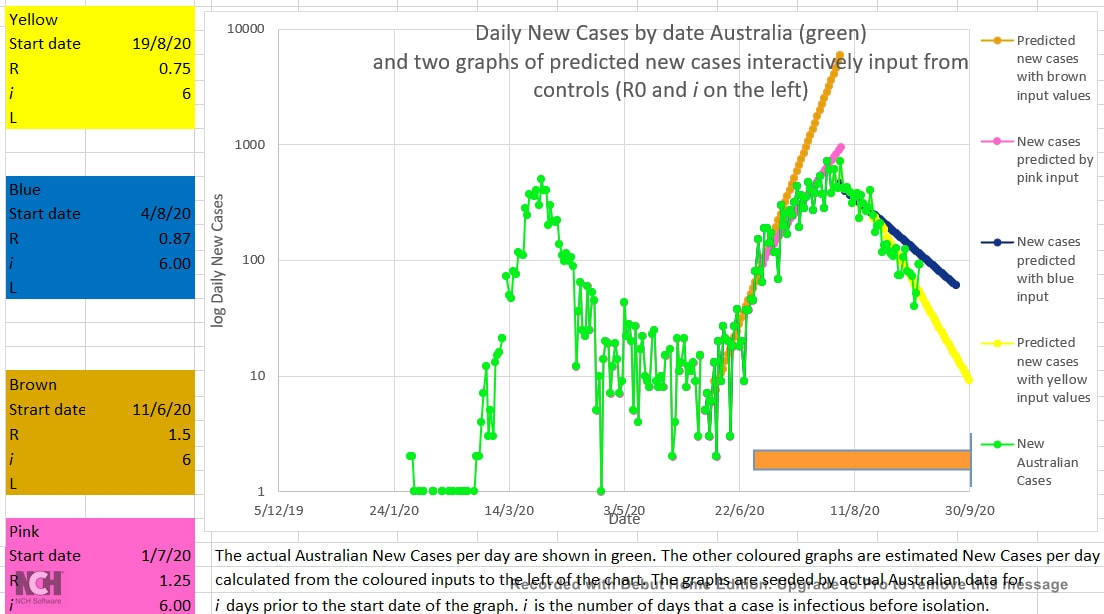 |
AuthorDr Michael Cole FRACP LLB Archives
September 2021
Categories |
 RSS Feed