Australia could keep the restrictions in place and then the last predictable case using this model could be as early as early May 2020. After that only an unexpected 'spot fire' or cases from overseas would likely need to be dealt with. Or restrictions could be eased to being 60% effective in reducing the infection rate, and then the last predictable case might be in late July 2020. 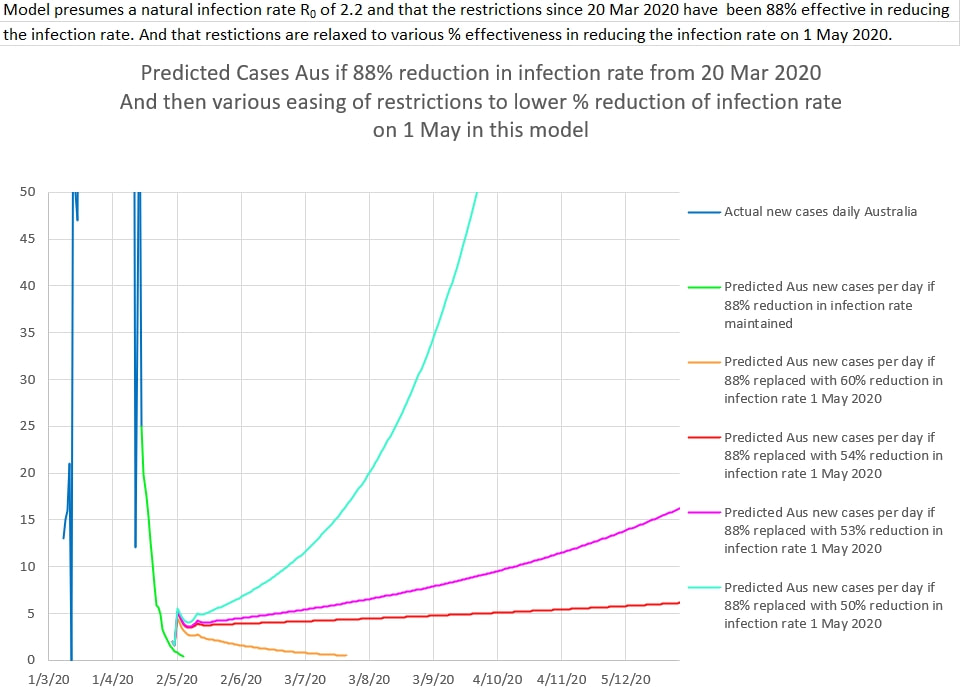 It would require a delicate balance, because reducing the restriction from 60% to 54% effectiveness in reducing the viral infection rate would be disastrous, resulting in a prolonged second slow peak. or worse (unless halted by the reintroduction of more effective restrictions). The number of extra cases that would occur by reducing the effectiveness of restrictions to 60% compared to keeping the restrictions at about 88% is only about 200 extra cases. The reduction of restrictions would be very good for some businesses - but how to do it fairly would be a major problem. Allowing some businesses to reopen, but under strict conditions, would be good for the economy, and not cost a lot in terms of sickness. The danger would be in the easing approaching anywhere near a 55% reduction in effectiveness of restrictions. That is a narrow margin. Restrictions that are 60% to 88% effective are fine. But to under 56% is a disaster. Obviously it will take a lot of care and perhaps some slow faltering steps to lessen the restrictions but not precipitate a disaster. 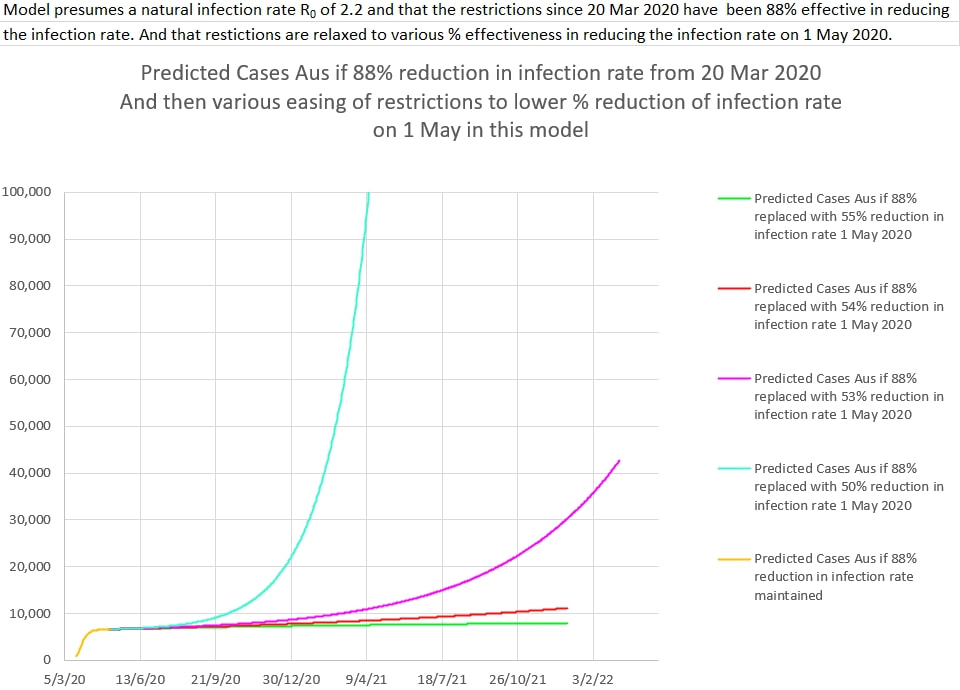 The number of cases if 88% effectiveness is maintained peaks at about 6550 cases (orange). And for 60% effectiveness it peaks at about 6750 cases.
0 Comments
Plotting the deaths per 1000 Covid 19 cases against the population densities (people living per square kilometer in the area) shows a (log) relationship. There are many possible confounding factors (especially the kinds of things make people live in high density areas) but it may suggest that viral load at the time of infection (crowding, contact time, being unable to socially distance) is a factor related to the likelihood that a case ends in death. Social distancing and lowering of the number of people in a building or shop at any one time may be important restrictions to maintain as restrictions are slowly rolled back. 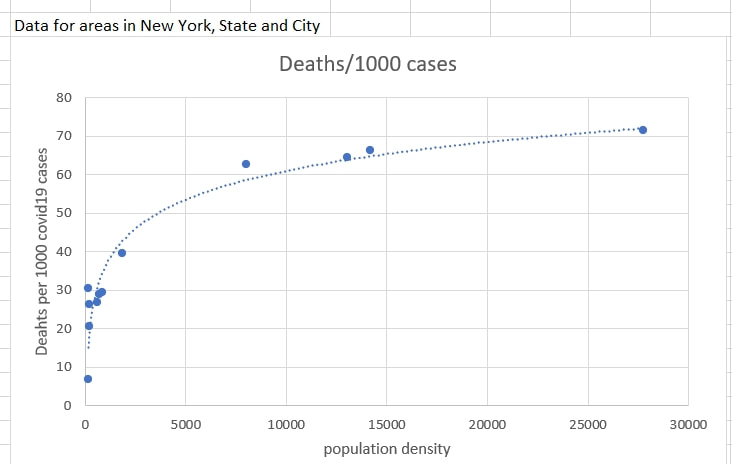 Data Source: https://www.citypopulation.de/en/usa/admin/
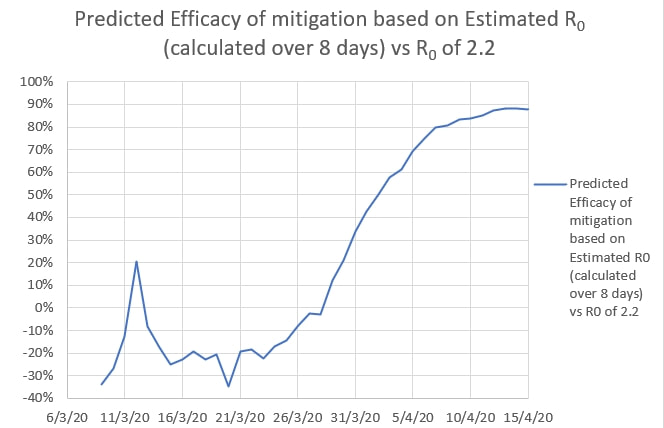
The current restrictions in Australia appear to be edging closer to 90% effective in reducing the infection rate. The number of new cases a day is dropping towards low numbers. So the question is: Given that the restrictions are hurting the economy, what level of reduction in infection rate should Australia aim for in lifting the restrictions? The short answer is one that keeps the apparent infection rate R0 below 1. And since the 'natural' R0 of the virus appears to be about 2.2 the restriction should at least achieve a 54.6% reduction in the infection rate to bring the apparent R0 to 1 or less. The graph produced by the infection model, below, shows the same thing as does the zoomed out version lower down. The 'wobbles' in the graph are artifacts caused by the sudden change in level of restrictions, rather than a more likely 'wash-in' of the effects over a few days. 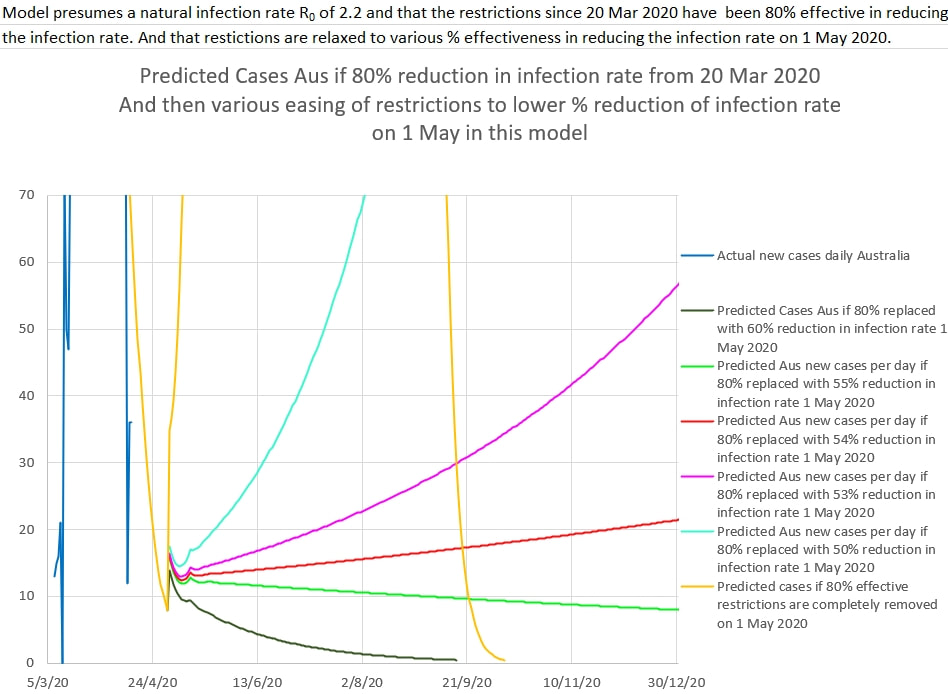 If restrictions are eased till they are only 54%, or less, effective at reducing the infection rate, then it simply sets off another exponential rise in new cases. The rise is either slow but very prolonged (years) or sudden and overwhelming. The good news is that if the eased restrictions are 55% effective or better, the new cases of infection steadily drops. But that level of restrictions would need to be maintained. If the restrictions were eased till they were still 60% effective at reducing the infection rate, new cases could be very low by September, and contact tracing could be very effective as long as the border was kept secure against surprise re-entry of the virus from elsewhere. 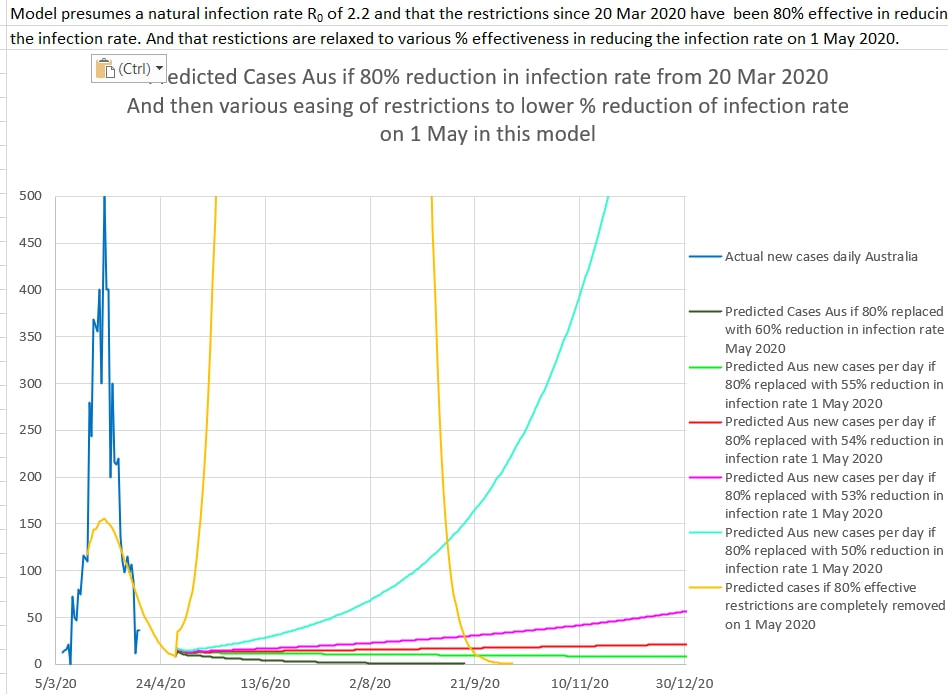 The apparent efficacy of the current restrictions in Australia seems to be at least 80% effective. The apparent R0 is well under 1.0 and generally the number of new cases each day is dropping. But this is probably not the time to back off. In fact, as NZ epidemiologist David Skegg argues, "it would be a terrible waste [of all the effort so far] if we don’t pull out all the stops now” and maintain lock-down while contact tracing eliminates the virus as much as possible and "tighten restrictions on those in quarantine after arriving from overseas" to prevent re-entry of the virus. After that is done, restrictions could be carefully lifted and business and the economy restarted. 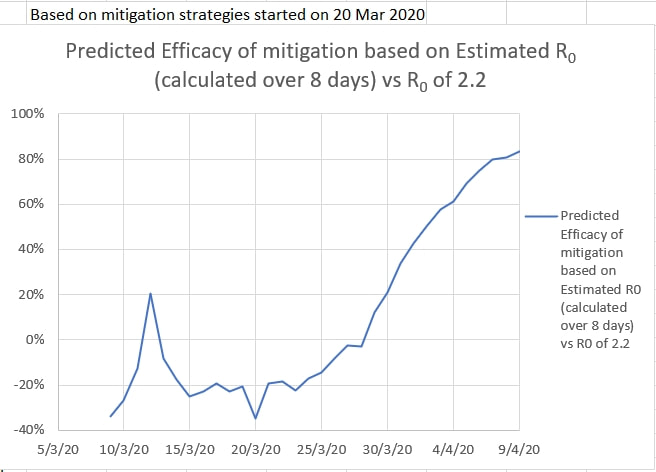 It is informative to plot Australia's new cases each day against a model estimating the percent efficacy of the restrictions supposedly started on 20 March 2020. The actual new cases per day should fall somewhere near the estimated new cases per day for 80% efficacy of the restrictions. From the graphs below, it seems to do that only for about a 40 day exponential wash-in period .
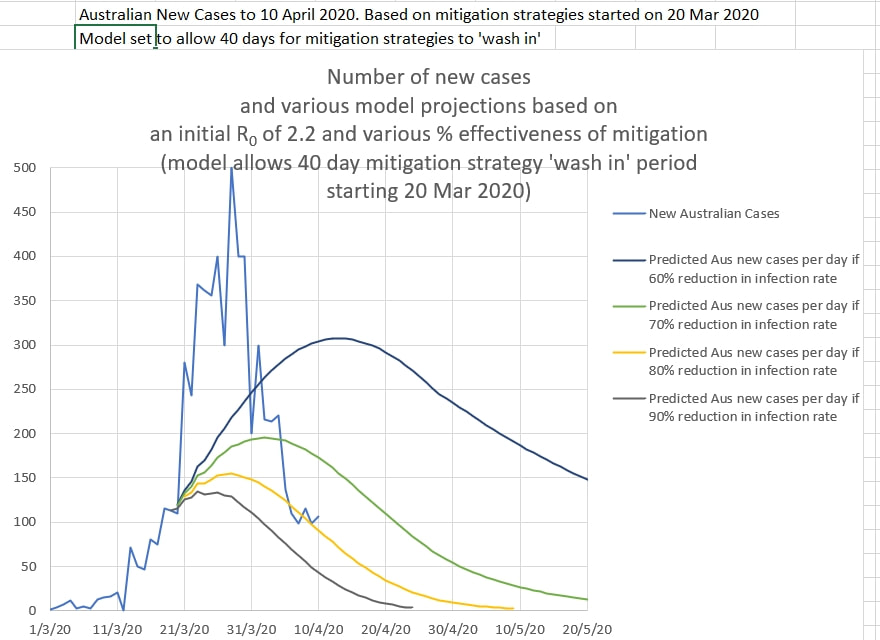 It appears that the wash-in period for restrictions to take full effect may be about 40 days. The 'bump' up above the 80% effective graph line (yellow) may be due to an excess of up to 350 new cases a day from the Ruby Princess.
There are some factors to consider when examining these curves. They presume that the restrictions were started on 20 March 2020 when, in fact, they were introduced piecemeal. And the model assumes that the unrestricted R0 was 2.2, a rough figure that is generally accepted. And luckily Australians were smart and started working from home, often at their employers request, and not sending their kids to preschool and school much earlier that the government and health department 'experts' enforced. The new cases in Australia are slowing. The ability to source trace new cases has not be overwhelmed. So it is definitely possible to eliminate the virus locally in Australia. I believe that is exactly what should be done. Then the problem would be keeping the Covid-19 virus from entering Australia again, or at least quickly eradicating any virus that does enter. It appears that the current restrictions are at least 80% effective in reducing viral infections. The apparent-R0 is currently 0.44 instead of the usually quoted figure of 2.2 new infected persons per infected person. 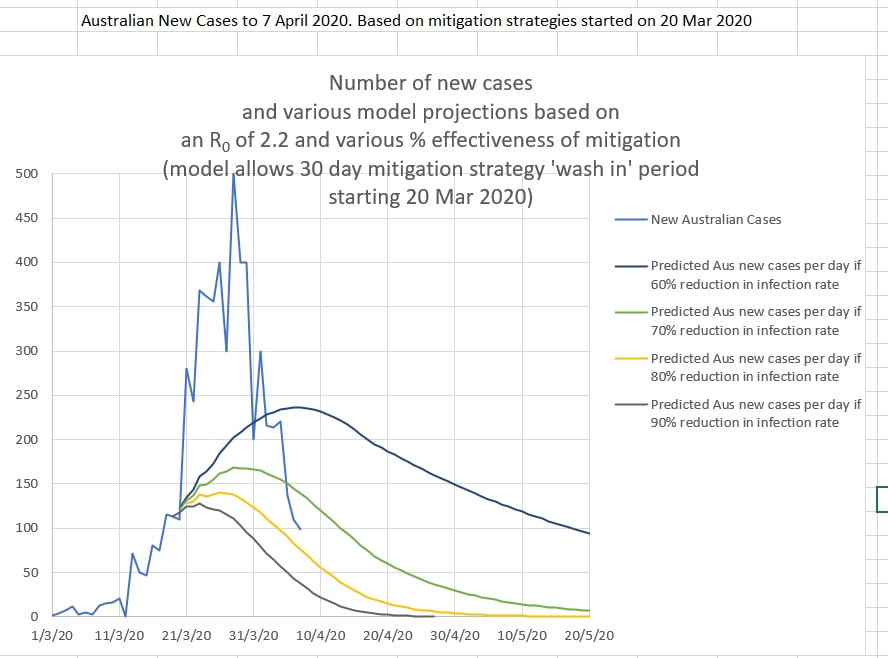 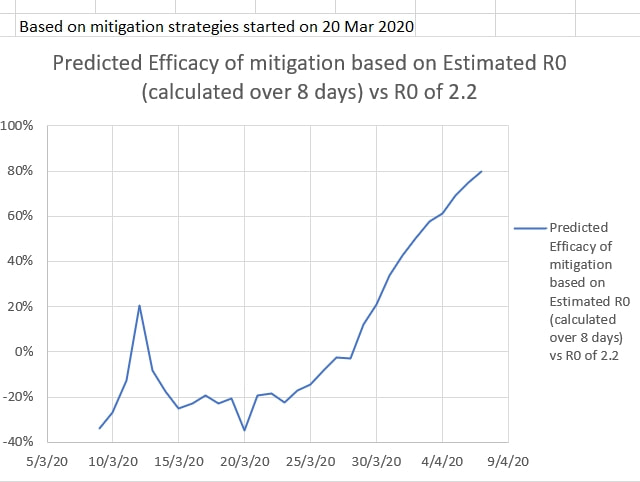 New Zealand isn’t just flattening the curve. It’s squashing it. It took only 10 days for signs that the approach there is working. The Washington Post.
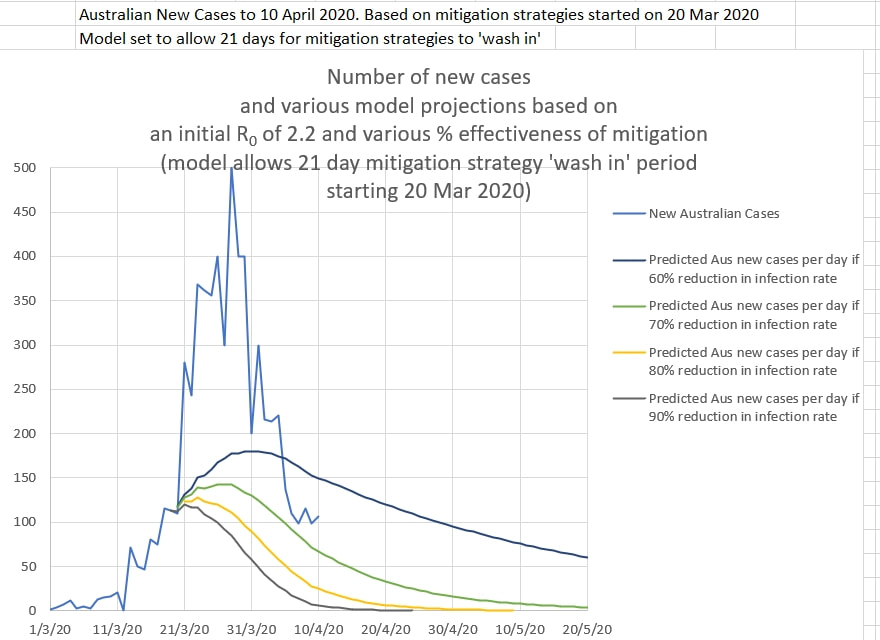
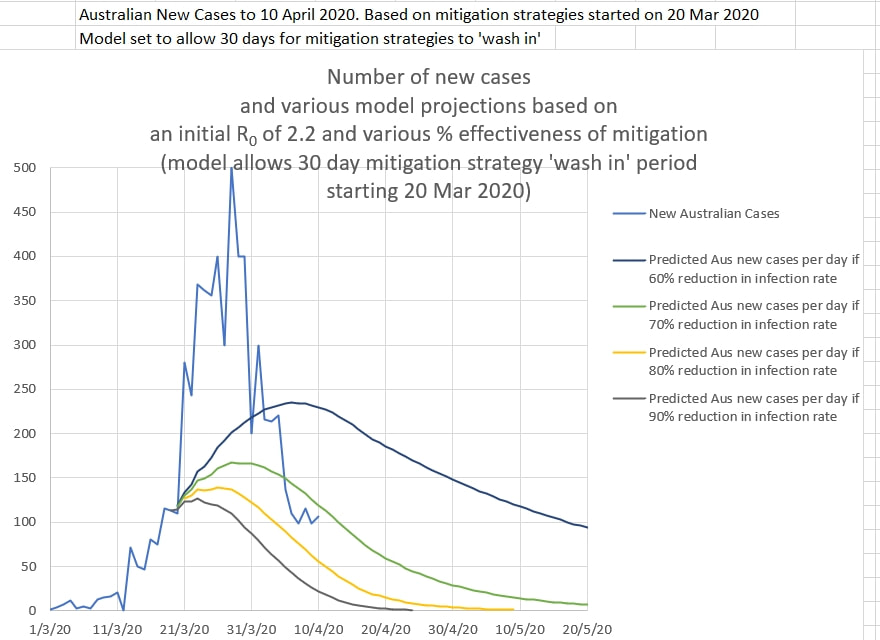
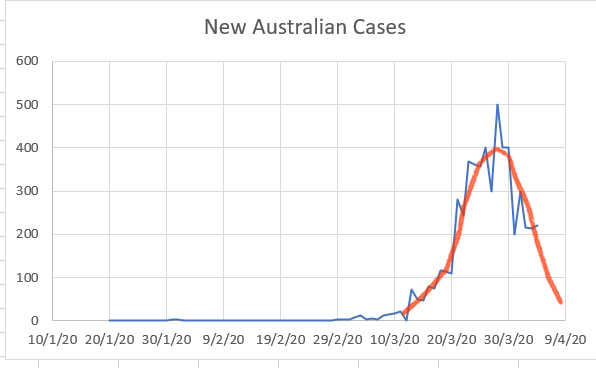
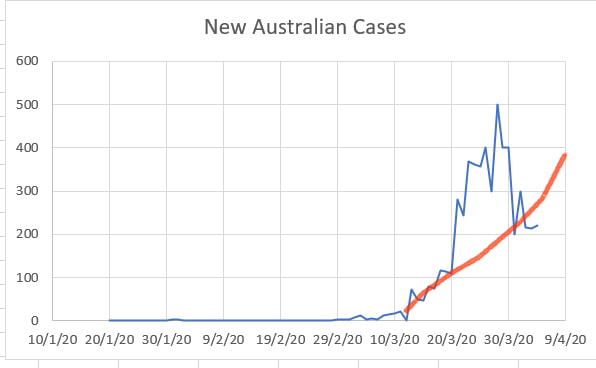
Let's do what New Zealand is doing. . The restrictions (mitigation strategies) in Australia have turned out to be very effective. The ability to contact trace has not been swamped. It may well be possible to eliminate the virus locally. Keeping the virus out with good border management would be difficult and prolonged because the virus will still be rampant out Australia. NZ epidemiologist, David Skegg, explains HERE. https://www.theguardian.com/world/2020/mar/31/tougher-new-zealand-rules-on-covid-19-could-set-it-apart-as-normal-nation-after-lockdown 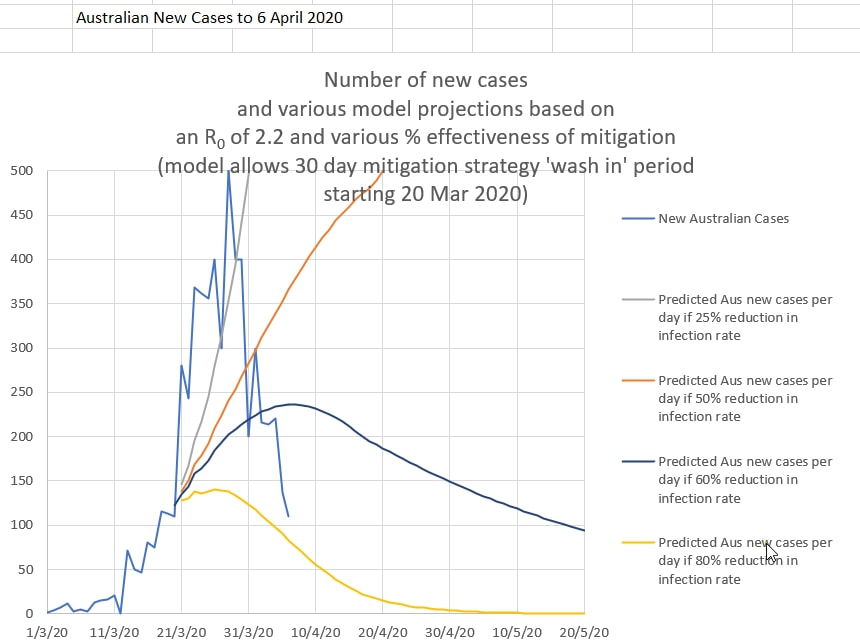 Today's graph of new cases in Australia looks very encouraging. Keeping up the social distancing and hygiene routines will be important. 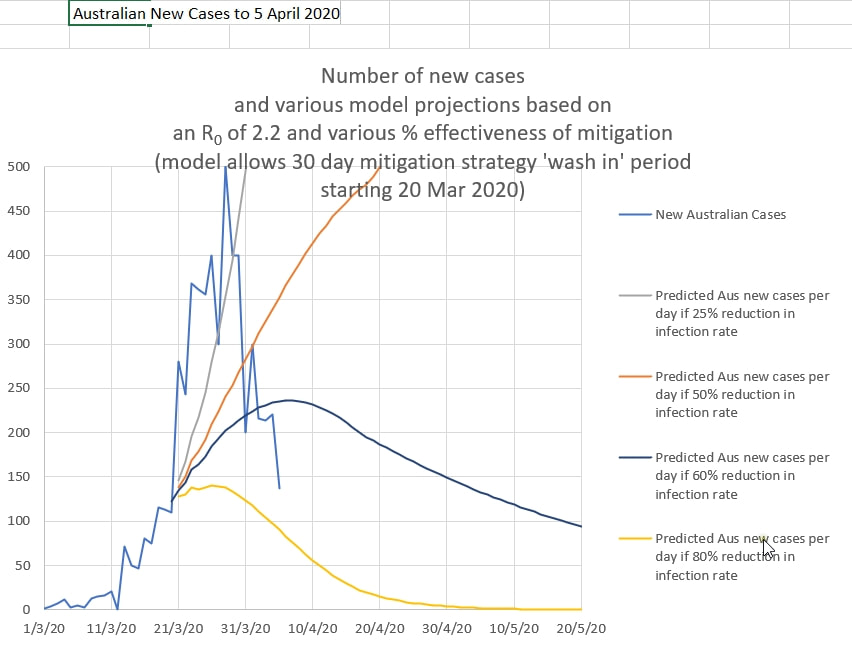 A fork in the Road. Which way is Australia going with COVID-19?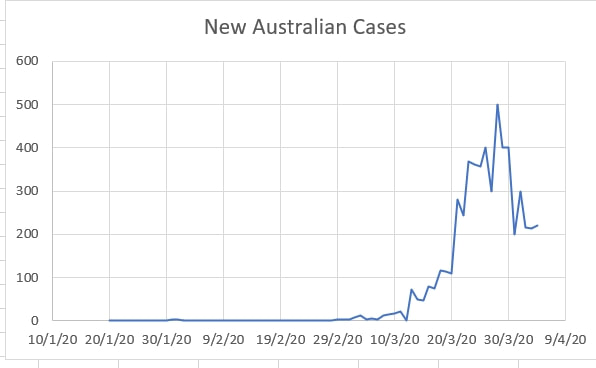 Recently the graph of new Covid-19 cases for Australia showed what the authorities thought might be a down-turn in new cases. It certainly appeared that way, as can be seen on the graph below. But does it just appear to be a down-turn in cases? Could it be that the 440 or so cases from the Ruby Princes caused a sudden up-turn in new cases? And now that no more of those original passengers are becoming infected , the number of new cases has dropped back to the original rate of expected new cases. In a nut-shell: Did the Ruby Princess passengers cause a "bump", a temporary up-turn and then a temporary down-turn in new cases. In that case there is no real down-turn in cases. It may just be a 'bump' in the graph, up then down, due to the Ruby Princess passengers. In that case, it is now that the graph of new cases will show which way Australia is heading, and just how effective or ineffective the restrictions (the mitigation strategies) have been so far. It certainly looks like a down-turn. But is it?
A genuine and much needed down-turn? Or a return to partially effective mitigation after the Ruby Princess "bump" has passed? The next few days might give the answer. 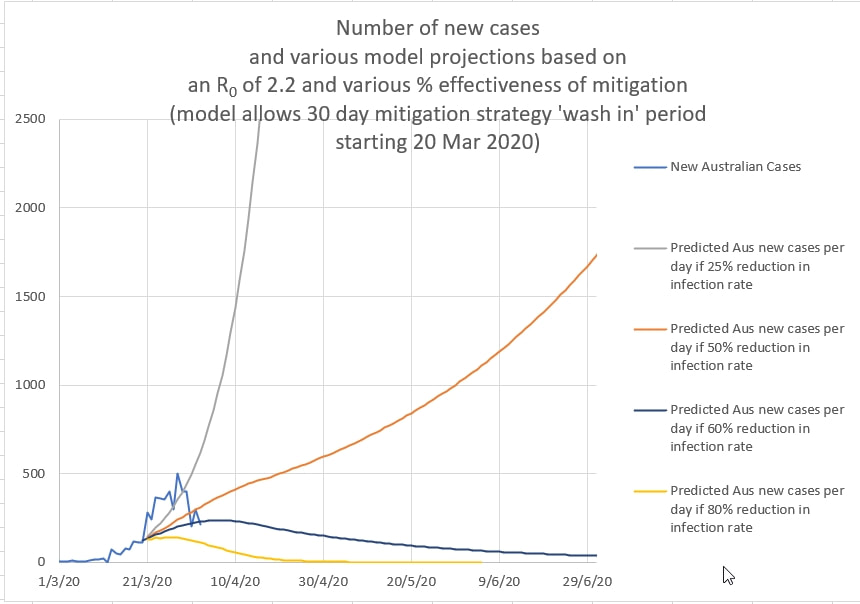 If the apparent down-turn continues then Australia has done well. If the down-turn does not continue, then it will be critically important to know whether the effectiveness of mitigation measures are about 50% or less effective, in which case Australia is in for a long difficult time - or 60% or more effective, in which case we can get through this in a timely manner without new cases swamping our medical teams.
|
AuthorDr Michael Cole FRACP LLB Archives
September 2021
Categories |
- Home
- Covid-19 US stats and projections
- The Epidemic Model
- The concept of a personal R
- Contact
- Blog
- Proportion Needed to Vaccinate
- Vaccinating Children
- Cases in Isolation to end the wave
- Model Predictions for 'opening up' in NSW
- The Case Fatality Rate (CFR) in Young Children
- Effective R amongst the Still Susceptible versus eR
- Estimating the 'Safe' rate of reduction of Restrictions
 RSS Feed
