Effective R amongst the Still Susceptible (Rs) versus eR
11 October 2021, updated 3 November 2021, Post Script 14 December 2021
This article argues that the effective R amongst the still susceptible (Rs, eRs) is a better and more intuitive and useful measure of the effective reproduction number of an infection than the default effective R (variously eR, Re, effR) commonly used bu epidemiologists and health advisors. Cases numbers and their relationship to Rs and eR for US, Singapore and Australia are used as examples.
This article argues that the effective R amongst the still susceptible (Rs, eRs) is a better and more intuitive and useful measure of the effective reproduction number of an infection than the default effective R (variously eR, Re, effR) commonly used bu epidemiologists and health advisors. Cases numbers and their relationship to Rs and eR for US, Singapore and Australia are used as examples.
We propose that Rs (the effective R amongst the susceptible) is more intuitive because it describes how the infectious agent is interacting with those in the population who are actually susceptible to the infection. In that way Rs is exactly like R₀. The difference is that R₀ measures the reproductive number at the start when the entire population is susceptible and there are no restrictions in place and no vaccinations, and Rs measures the same thing as less of the population remains susceptible. Both only measure the reproductive number amongst the susceptible - the only place where the infection is active and spreading. R₀ measures it at the start and Rs measures it thereafter. The non-susceptible are irrelevant (agnostic) to the infection and by not excluding them the utility of eR (the default effective R, currently often quoted) is diluted and eroded. Rs shows when and to what extent the infection is epidemic (exponential) amongst the susceptible individuals in a population even when eR is (falsely reassuring) below 1. Thus eR may be misleading to health advisors, politicians and the public.
The effectiveness of restrictions (EOR) (called non pharmaceutical interventions) is directly related to Rs and, on a chart, is simply an upside down scaled mirror image of Rs. eR, on the other hand gives little direct insight into the effectiveness of restrictions.
The difference between effective R (eR, the default common measure of the commonly used effective reproduction number of the infection) and the effective R amongst the still susceptible (Rs) is that eR measures only the number of newly infected a day divided by the average number who infected them per day and nothing else, not even the population size, whereas Rs measures the same things, but assumes that the infections are only occurring amongst the susceptible by adjusting for the proportion of the population that remains susceptible. The Rs removes non-susceptible individuals from consideration by subtracting those who are no longer susceptible due to past infection or vaccination. So Rs measures the effective reproduction number of the infectious agent amongst the still susceptible proportion of the population - which is where the virus is active. Non-susceptible individuals play no part in transmission and restrictions have no effect on them. Not all past infections or vaccinated individuals can be subtracted because those interventions are only partially effective at preventing infection, so their efficacy is taken into account.
eR = effective R = number of new cases / mean daily number of cases which infected the new cases
Rs = effective R amongst the susceptible = (number of new cases /mean daily number of cases which infected the new cases) * (population / (population - non susceptible individuals))
If the proportion of the population vaccinated with 1st only and 2nd dose are v1 and v2 and the vaccine has an efficacy of e1 and e2 respectively and if the efficacy of prior infection for the current strain at preventing a further infection is f then the non susceptible individuals number = e1v1P + e2v2P + (f * cumulative infections to date). If the population is P and the cumulative total cases is T then:
Rs = effective R amongst the susceptible
= (number of new cases / mean daily number of cases which infected the new cases) * (P / (P - e1v1P - e2v2P - fT))
= (number of new cases / mean daily number of cases which infected the new cases) * (1 / (1 - e1v1 - e2v2 - fT/P))
Rs is greater that eR by a factor of 1/(1 - e1v1 - e2v2 - fT/P)
Rs is useful for two reasons
1. The effectiveness of restrictions, known as NPIs, can be directly calculated from Rs, and
2. It allows an intuitive understanding of what is driving or retarding the new infection numbers.
The drivers of the infection (R) and the restrictions (NPI)s are acting on the susceptible only. The non-susceptible are agnostic; they are not driven or restricted and produce no new infections and do not play a part in infection spread. The default effective R (eR) on the other hand does not even take population into account, and to the extent that some type of population is implied it lumps susceptible and non susceptible individuals together. By comparing the definitions of Rs with eR it can be seen that eR implies that (1 / (1 - e1v1 - e2v2 - fT/P)) = 1, and thus that e1v1 + e2v2 + fT/P = 0 and thus that every individual is presumed permanently susceptible, which is not true. Or, in other words, eR does not take into account the changing susceptibility of the population.
The effectiveness of restrictions (of NPIs) can be calculated from Rs.
Efficacy of Restrictions (EOR) = 1 - (Rs/R₀)
where Rs is constrained to the range 0 to R₀. The constraint is necessary because published case data does fluctuate markedly probably because it is batched during collection and compiling and thus contains false high frequency signals. When new strains appear the R₀ can be adjusted according to the proportions of the strains and their individual values of R₀. EOR is in the range of 0 to 1 (or 0% to 100% effective at inhibiting viral replication).
It is initially difficult to determine what any change in EOR means specifically. It may relate to the introduction of a restriction or improved compliance with restrictions or the slow onset of the effect of restrictions as high infectors (like truck drivers, large households) become non-infectious and the virus struggles to replicate in low infectors (like single dwellers or non party goers); one possible 'Network' model of viral spread. It may be possible, later, to map certain values of EOR or change in EOR, to particular interventions.
eR as a measure of the drivers of an infection
The difference between eR and eRs can be seen in the current wave of Covid-19 in the US and Singapore in the charts below.
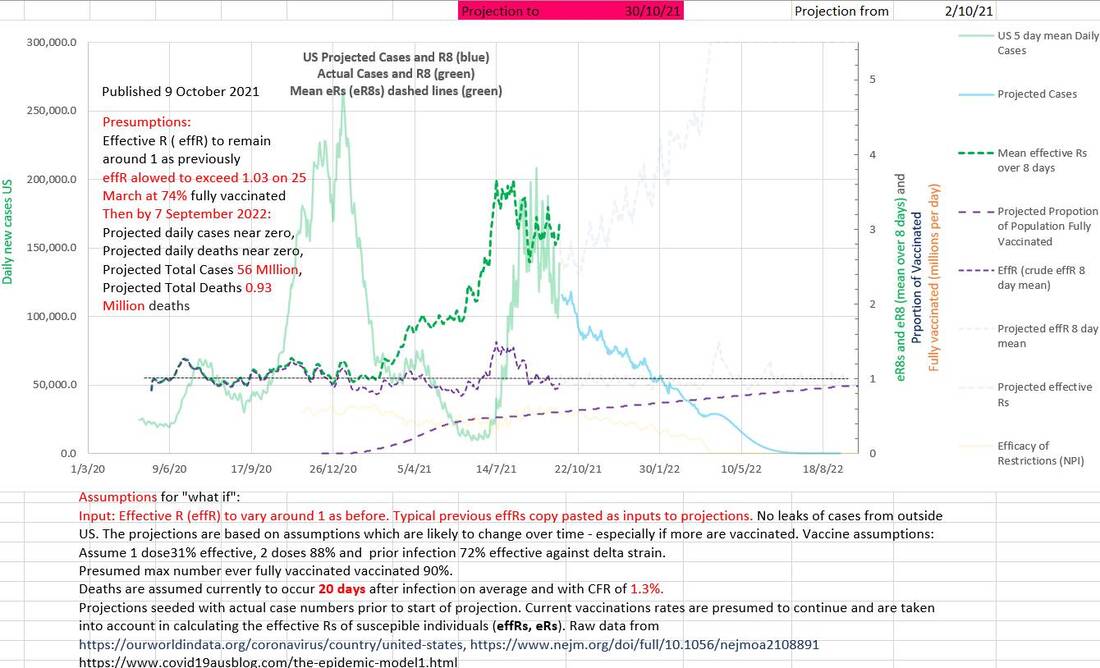
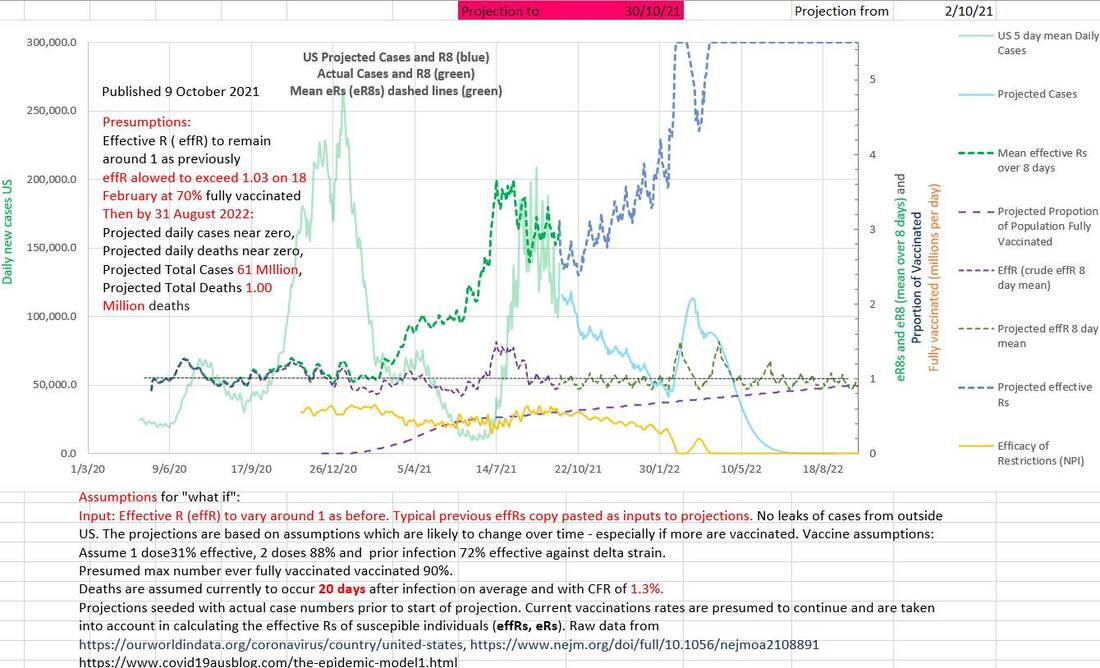
In the US the eR has remained at around 1 for nearly all of the epidemic. One hypothesis would be that health advisors, politicians and the public use eR in part to determine their behaviour (response), increasing restrictions and vaccination rates when case numbers increase, especially if a wave is occurring. And relaxing them when case numbers decrease. A useful property of eR is that an eR of 1 is the threshold above which case numbers increase, or below which case numbers decrease. But it may be that keeping eR just below 1 is a false goal; it may encourage restrictions to be eased which in turn delays the further reduction in case numbers. eR may also give a false signal when it deceases as vaccination is rolled out. If vaccination increases then a stable eR near 1 hides the fact that stable case numbers while the number of susceptible individuals is shrinking means that the infectious spread amongst the susceptible is increasing. If Rs was monitored it would show increasing transmission amongst the susceptible producing the 'epidemic of the unvaccinated'.
Rs diverges from eR once vaccination is introduced (the proportion of the population fully vaccinated is shown as a dashed purple line with values 0 to 1 on the right axis on the chart below). Rs and eR are almost identical early in the epidemic when most of the population is susceptible. During the first wave shown, it can be hypothesized that several attempts to bring case numbers down were defeated in turn when case numbers started to come down encouraging the premature and excessive easing of restrictions. The same mechanism can be hypothesized towards the end of the wave resulting in a mini peak (late march to mid April 2021). The eR of about 1 hid the fact that the R amongst the susceptible (Rs) was increasing from 1.2 to 1.6 because the vaccine roll-out was decreasing the proportion of the population that was susceptible. Similar case numbers coming from an increasingly smaller pool of susceptibles indicates increasing spread. The Rs was already 1.6 (epidemic) when the Delta strain appeared.
In the chart above, the eR (effR) less than 1 at 2nd October 2021 may suggest that the wave is 'under control' and case numbers would continue to fall. But there are two potential flaws in that belief. The first is that the effective R amongst the susceptible portion of the population (Rs) is over 3 and certainly 'epidemic' amongst them, and secondly the apparent natural inclination, on seeing an eR less than 1 would be to ease up on restrictions which may precipitate another increase in case numbers.
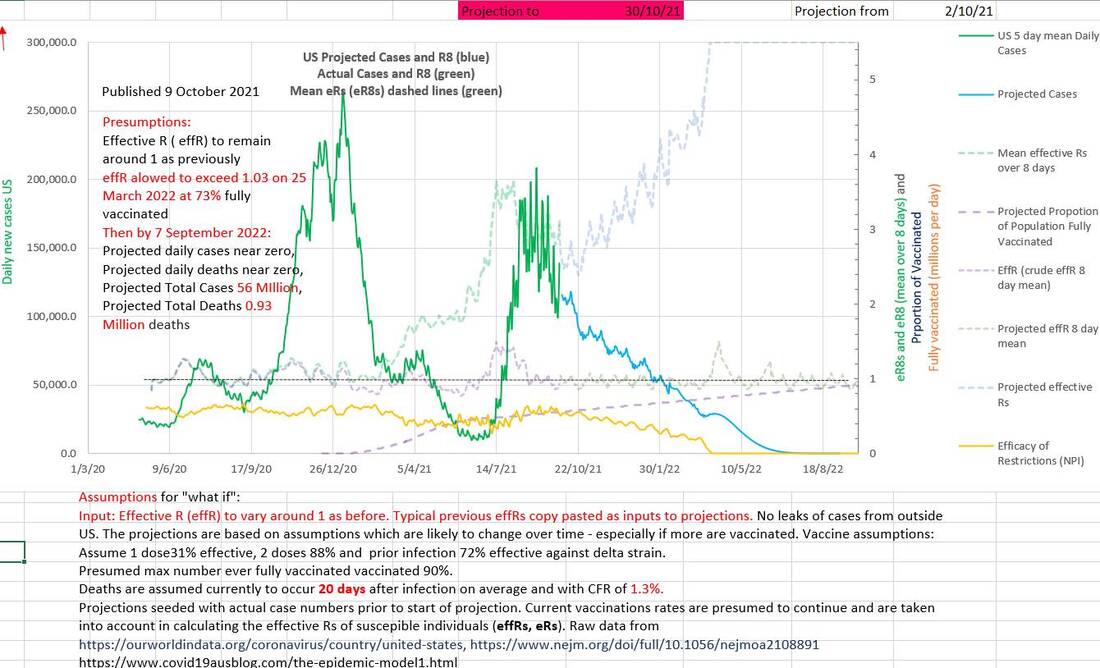
In the chart of the same data below, the effectiveness (EOR) of the restrictions or NPIs (in orange) has been calculated from the Rs and is 1 - Rs/R₀ where Rs is constrained to the range of 0 to R₀, (and R₀ increased appropriately from 2.5 to 5.5 as the Delta strain became predominant). The maximum effectiveness of the restrictions was 67% in September 2020 and had already fallen to 40% efficacy by April 2021 (probably a response to falling case numbers, low eR and the success of the vaccination program) before the Delta strain entered the US after perhaps late April. If eR continues to be kept at about 1 from 2 October onwards (as before) the calculated consequences would be that cases would continue to fall, the Rs would climb to R₀ (5.5) and the restrictions (or NPI) must have fallen appropriately slowly to zero.
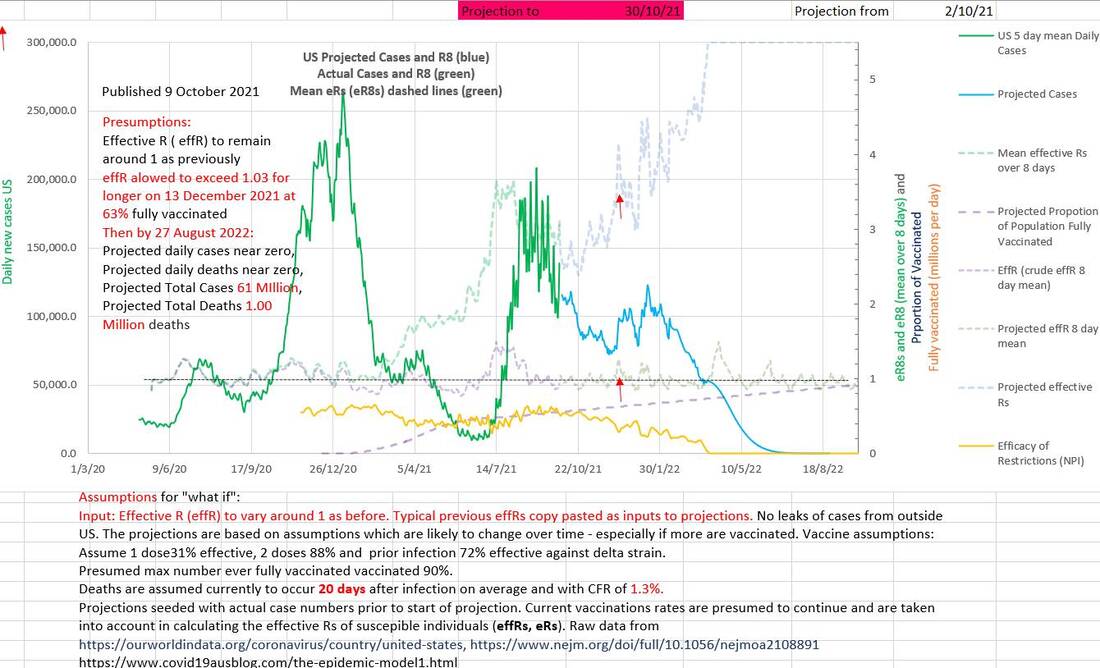
If the same two spikes in eR that occurred from November 2020 to mid January 2021 were allowed to occur again in December 2021, a spike in Rs and in case numbers would occur (shown on the chart below). The efficacy of restrictions shown (in orange) would be shown to have decreased. It would result in an extra 5 million cases and an extra 70,000 deaths.
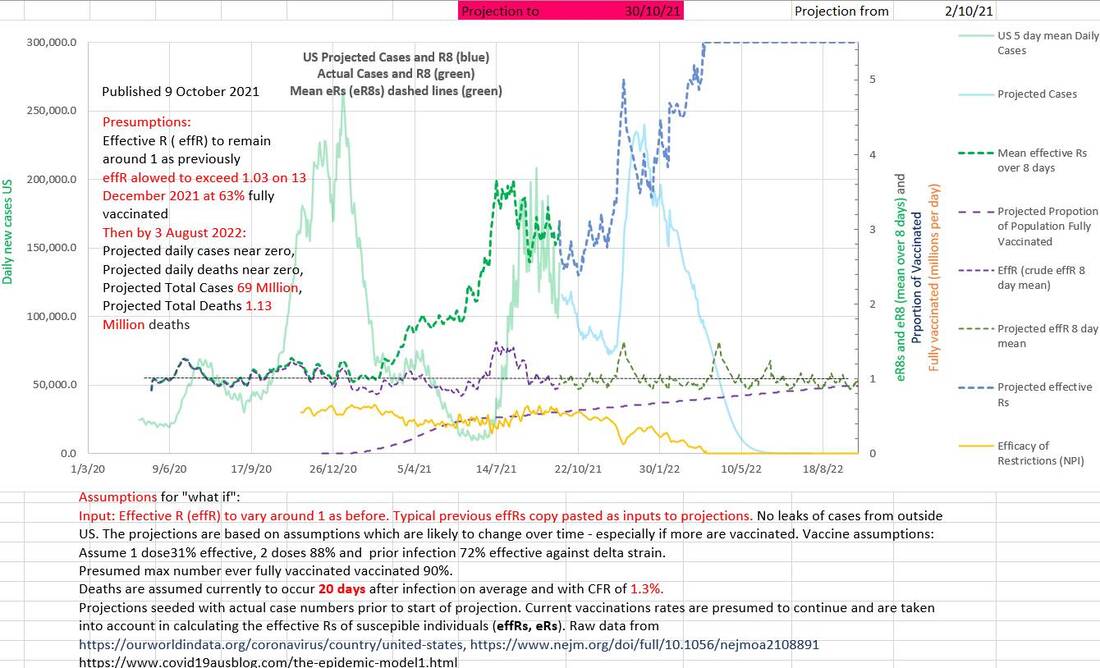
The earlier that an injudicious decrease in effectiveness of restrictions, EOR, occurs, the greater is the effect on case numbers and deaths. In the charts below the same un-remedied spike in eR in December 2021 produces worse effects on cases and deaths than it does in February 2022.
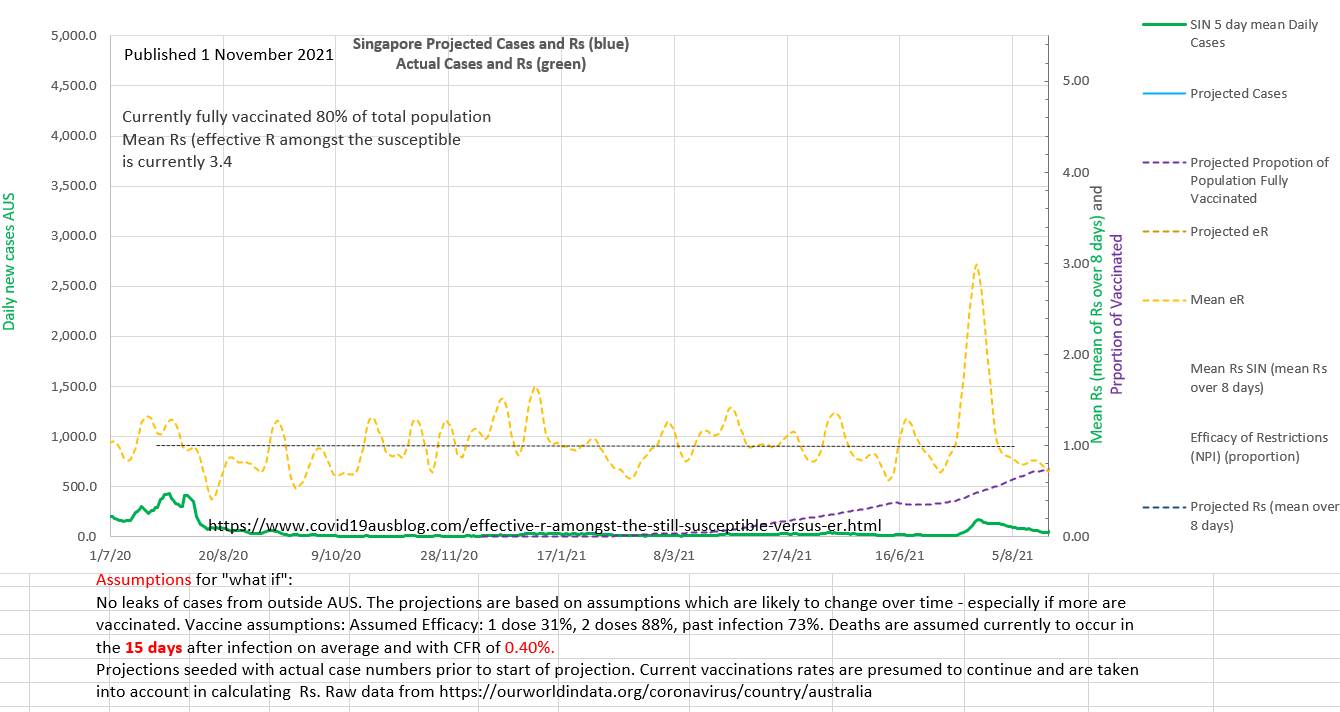
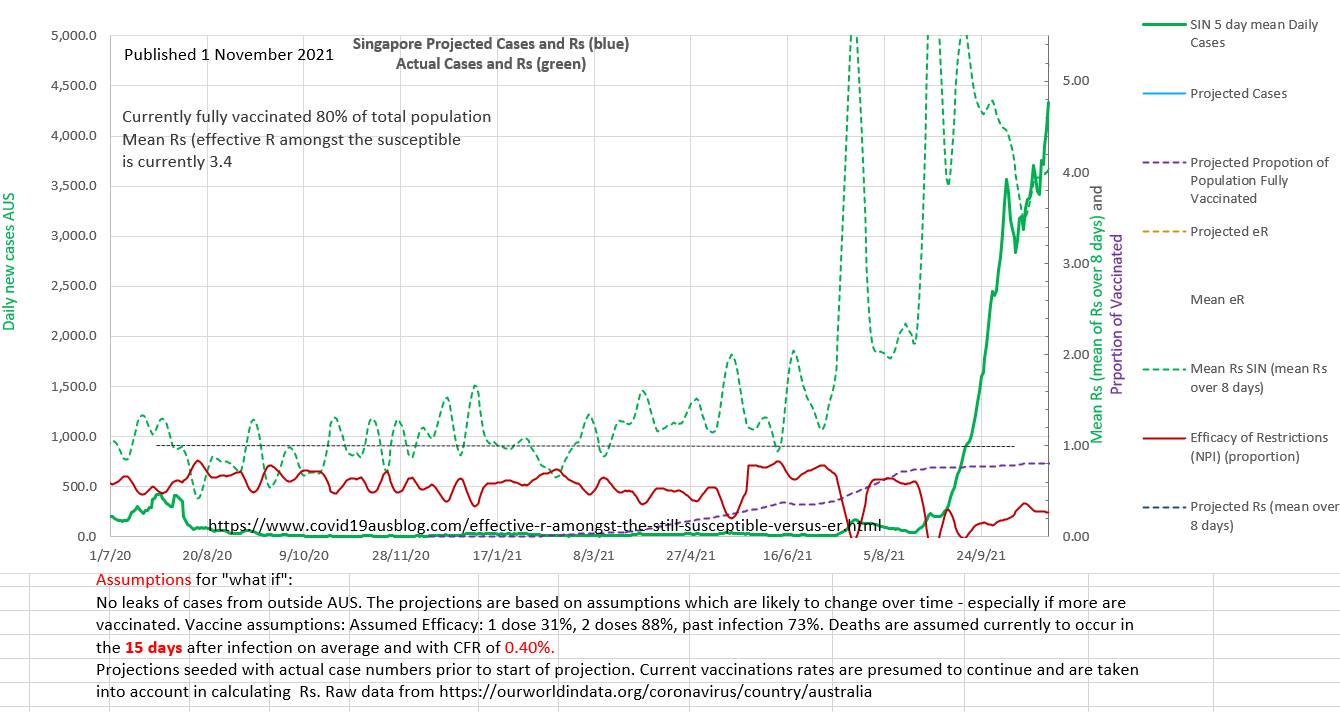
Singapore has been doing very well in the epidemic. At 21 August 2021 the position is shown on the chart below. The number of new cases a day is well below 100 (in green at bottom right), the effective R (effR or eR), traditionally used by epidemiologists using the SIR type models, is well below 1 and the recent little wave is under control and has reanimated the vaccination program.
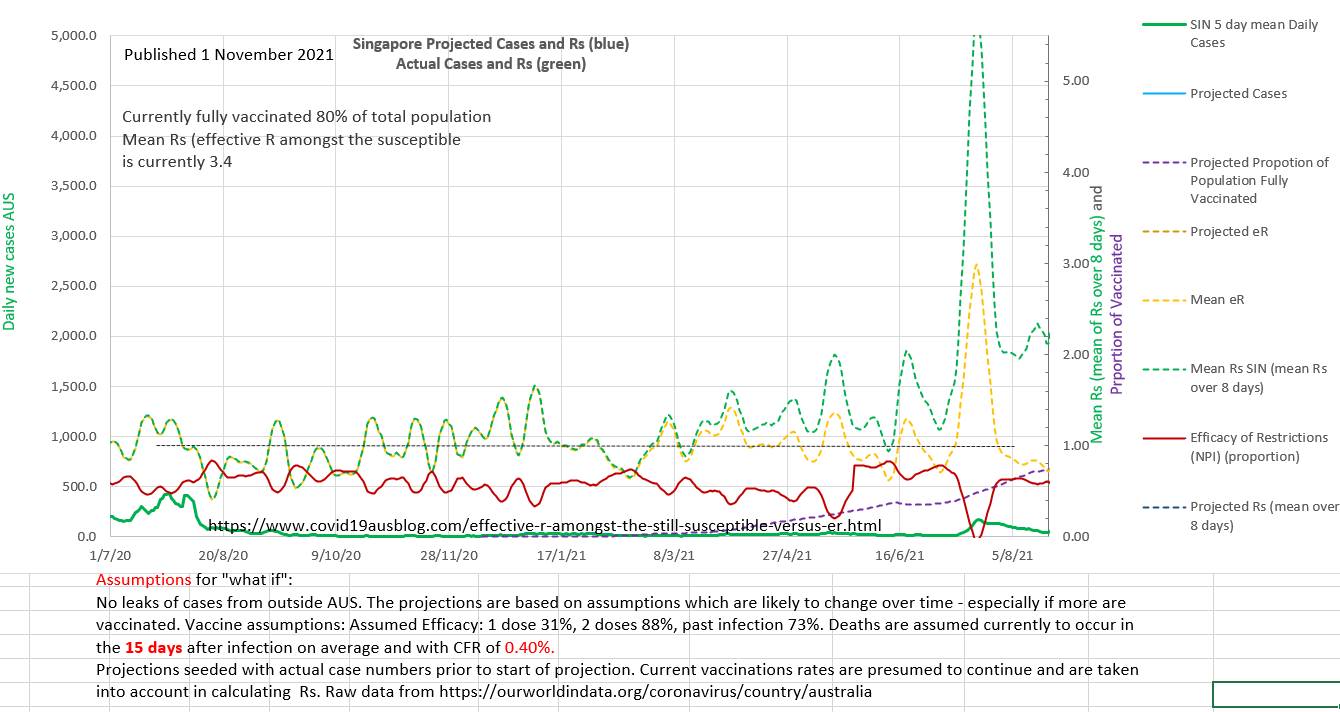
But what would Rs demonstrate, and the efficacy of restrictions (EOR) derived from Rs? On the chart below, Rs demonstrates that the infection is actually epidemic amongst the susceptible and the Rs is 2 (almost maximal for the earlier alpha strain R₀ of 2.5) and the restrictions have still not returned to their previous values (EOR). Rs has been steadily rising since 19 February 2021. The EOR fell from 19 February 2021 till 25 May when it corrected before continuing to decline. As vaccination rolls out the susceptible population shrinks in size and so any cases represent a higher Rs value than they did. So Rs moves higher and away from eR as vaccination progresses.
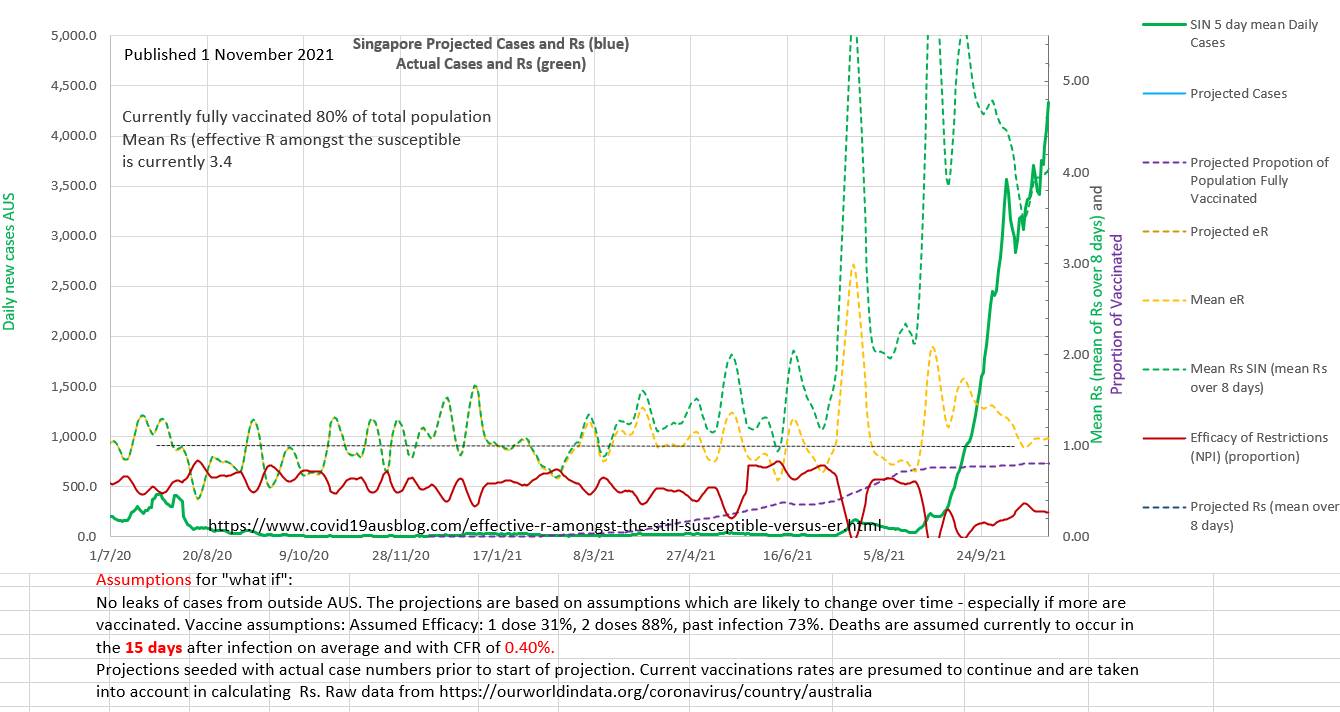
The outcome is shown on the chart below. From an eR well below 1 an epidemic took off. The replication number amongst the susceptible in the population was over 2 and climbed rapidly. The efficacy of the restrictions was very low. The reasons for the low EOR may have included a) the arrival of the Delta strain b) poor compliance with restrictions c) official easing of restrictions based on good vaccination numbers and low eR as the initial little wave came under control in August 2021.
It seems likely that monitoring Rs and EOR might have alerted authorities to the 'sentinal' spike in August 2021 and the deteriorating EOR and rising spread of the virus amongst the susceptible (Rs).
Raising the EOR to 40% and increasing the vaccinations to 90% of the population (or increasing the efficacy of the vaccinations per person by using boosters) would limit the current wave.
The proportion (of the population) needed to vaccinate (PNV) with mRNA vaccines (88% two dose efficacy) is 93%. But PNV would be lower using boosters where the efficacy is increased (95.6%) the PNV would reduce to 86% of the population.
Currently 80% of the population is vaccinated. So 20% are susceptible, and age <14 make up 12% of the population in Singapore. So age <14 make up 60% of the susceptible population in which the infection is still epidemic.
Singapore has a remarkably low CFR of only 0.0040 (0.4%) (allowing for a 15 day lag between reported case and death).
In Australia the policy until recently has been to to keep viral spread in the community to zero using isolation and other non pharmaceutical interventions (NPI) and quarantining new arrivals from overseas. Various States closed borders to other States. Currently vaccination is underway and NSW has started 'opening up' by reducing NPIs once 80% of over age 16 (>16) in NSW had been vaccinated (64% of the total population of NSW). 57% of vaccinations in Australia have been with Pfizer, the remainder with AstaZenica. The combined efficacy was taken to be 31% first dose and 82% second dose for the mix. And the efficacy of past infection to prevent a further infection was 72%. NEJM article here.
In theory it should not be possible to prevent a new wave of infection in Australia by vaccination.
The proportion needed to vaccinate without restrictions, PNV, is (1 - 1/R₀ - (FT)/P)/E
where R₀ is the reproduction number of Delta strain, F if the efficacy of past infection to prevent infection, T is the cumulative number of past cases, P is the total population and E is the efficacy of the mix of vaccines used.
In Australia the proportion needed to vaccinate, PNV = (1-1/5.5 - 0.72*130,000/25,800,000) / 0.82 = 0.0993 (= 99.3% whole population fully vaccinated) which is unlikely to occur (or is too close to 100% to be effective). So either a 3rd vaccine dose or some form of restrictions (NPI) will be required in addition to vaccination with the current mix.
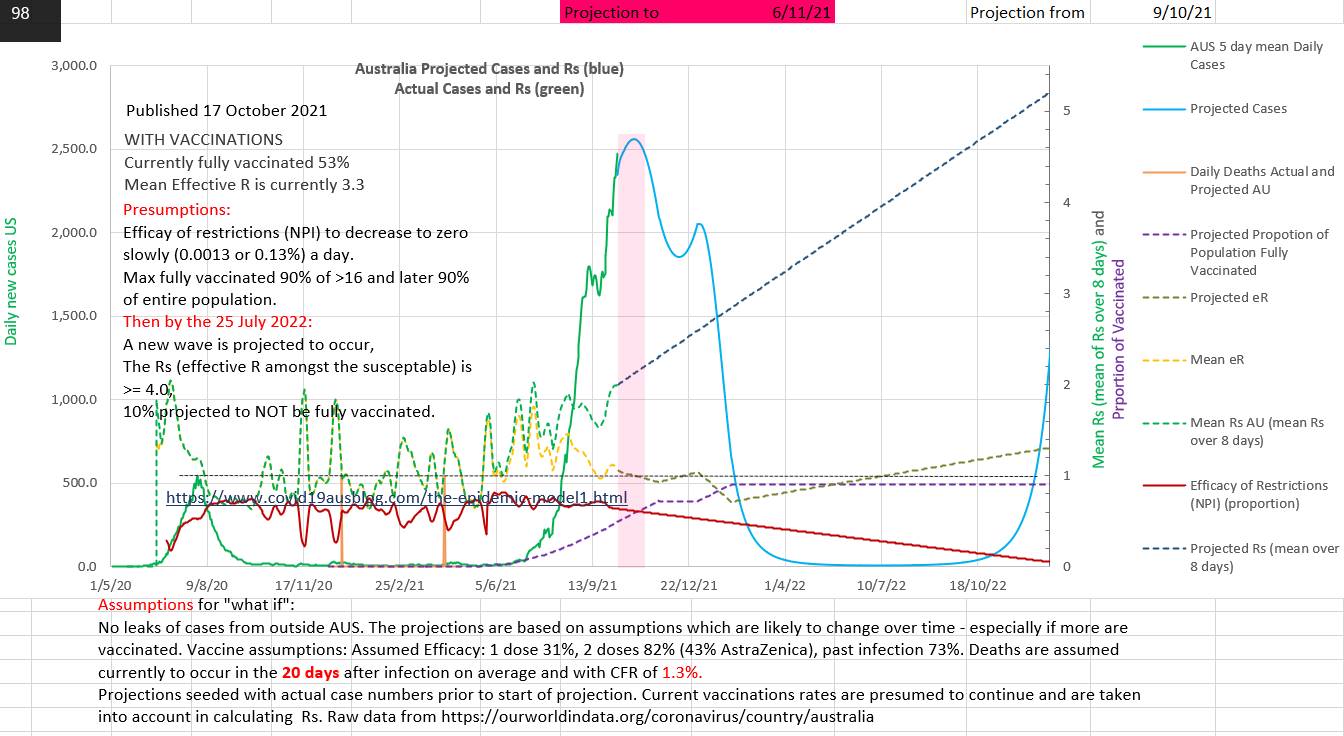
In the chart below the efficacy of restrictions EOR (efficacy of NPI) (a proportion between 0 and 1) in the model were reduced from the current level (9 Oct 2021)to zero. The outcomes produced by different rates of reduction of the efficacy of restrictions (EOR) vary widely. The very slow reduction of EOR (by 0.0013 a day) was the fastest that did not produce an immediate wave.
It can be noted in the chart above that the effective R amongst the susceptible (Rs) moves away from the effective R (eR) once vaccination starts. It also moves away as cumulative cases increase, but the difference is small and only easily seen in the peaks of Rs. Rs can also be seen to be inversely proportional to the efficacy of restrictions (EOR). That accords with the fact that Rs measures the R amongst the susceptible (not those who are no longer susceptible) and that the restrictions (NPI) act against the susceptible, restrictions having no effect on the non-susceptible. So Rs reaches R₀ when EOR reaches zero. eR reduces with vaccination and an increases in EOR. eR can be misleading because it is the nearly the same as Rs in the early epidemic stage, but once vaccination begins eR hides the fact that the reproduction number amongst the susceptible (Rs) is rising even though cases may be declining quickly and encouragingly. The minimum number of cases prior to the next wave projected in July 2022 was 6 new cases a day.
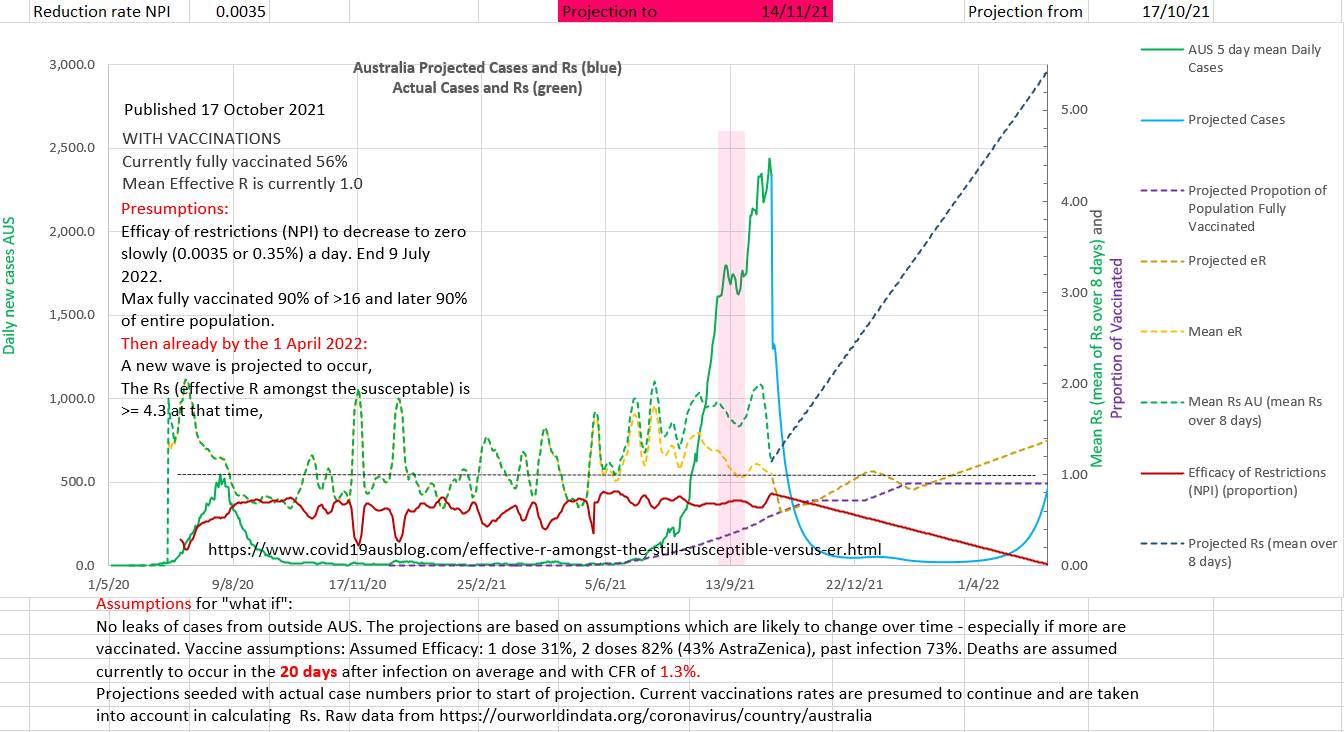
Surprisingly Rs (the effective R amongst the susceptible - the only group in which restrictions are effective) dropped sharply in the last week in Australia (the chart below). This may have represented new restrictions put in place and/or better compliance with restrictions. Probably in Victoria because eR, Rs and efficacy of restrictions are measures which only apply where the virus is replicating. They don't have meaning where there is no viral replication.
The chart above suggests that cases declined sharply because restrictions became effective or more effective recently, including the introduction of more restrictions. So, the projected slow 'opening up' from these restrictions starts at a higher EOR. Predicting how fast restrictions will be eased is impossible, but various rates can be compared with each other. All rates should ultimately fail because the proportion needed to vaccinate (PNV), calculated above, suggests that even 100% vaccinated will not be effective with 43% AZ in the mix and no restrictions. In the above chart restriction are input as reducing by 0.0035 per day. New cases daily decrease as children over 5 are vaccinated, but produce a new wave starting about 1 April 2022.
Rs may potentially be under or over estimated
Infections occur in some individuals who are vaccinated or recovered from past infections, so 1 - e1v1 - e2v2 - fT/P may count an individual twice and underestimate the number of susceptible individuals, thereby over estimating Rs. Alternatively, vaccine efficacy may wane over time, over estimating the susceptible and underestimating Rs. Setting f = 1 may produce a better estimate of Rs late in the epidemic. 'Real World' values of e2 after the roll-out of vaccination are often higher than the e2 published in the initial phase III trials.
Infections occur in some individuals who are vaccinated or recovered from past infections, so 1 - e1v1 - e2v2 - fT/P may count an individual twice and underestimate the number of susceptible individuals, thereby over estimating Rs. Alternatively, vaccine efficacy may wane over time, over estimating the susceptible and underestimating Rs. Setting f = 1 may produce a better estimate of Rs late in the epidemic. 'Real World' values of e2 after the roll-out of vaccination are often higher than the e2 published in the initial phase III trials.
In Summary
The effective R operating on the still susceptible, Rs (or eRs), has a number of advantages over the default effective R, eR.
Rs is more intuitive. It describes how the infectious agent is interacting with those in the population who are actually susceptible to the infection. It shows when the infection is epidemic amongst the susceptible individuals in a population even when eR is below 1. The eR may be misleading to health advisors, politicians and the public because it may hide epidemic spread amongst the susceptible even when new case numbers are decreasing and eR is less than 1. The non-susceptible are irrelevant (agnostic) to the infection and restrictions and not excluding them dilutes the utility of eR.
The effectiveness of restrictions or non pharmaceutical interventions, EOR, is directly related to Rs (and not eR) and equals 1 - (eRs/R₀). The effectiveness of restrictions graphs as an upside down scaled mirror image of Rs. eR, on the other hand gives little direct proportional insight into the effectiveness of restrictions or the effectiveness of the vaccination program.
POST SCRIPT
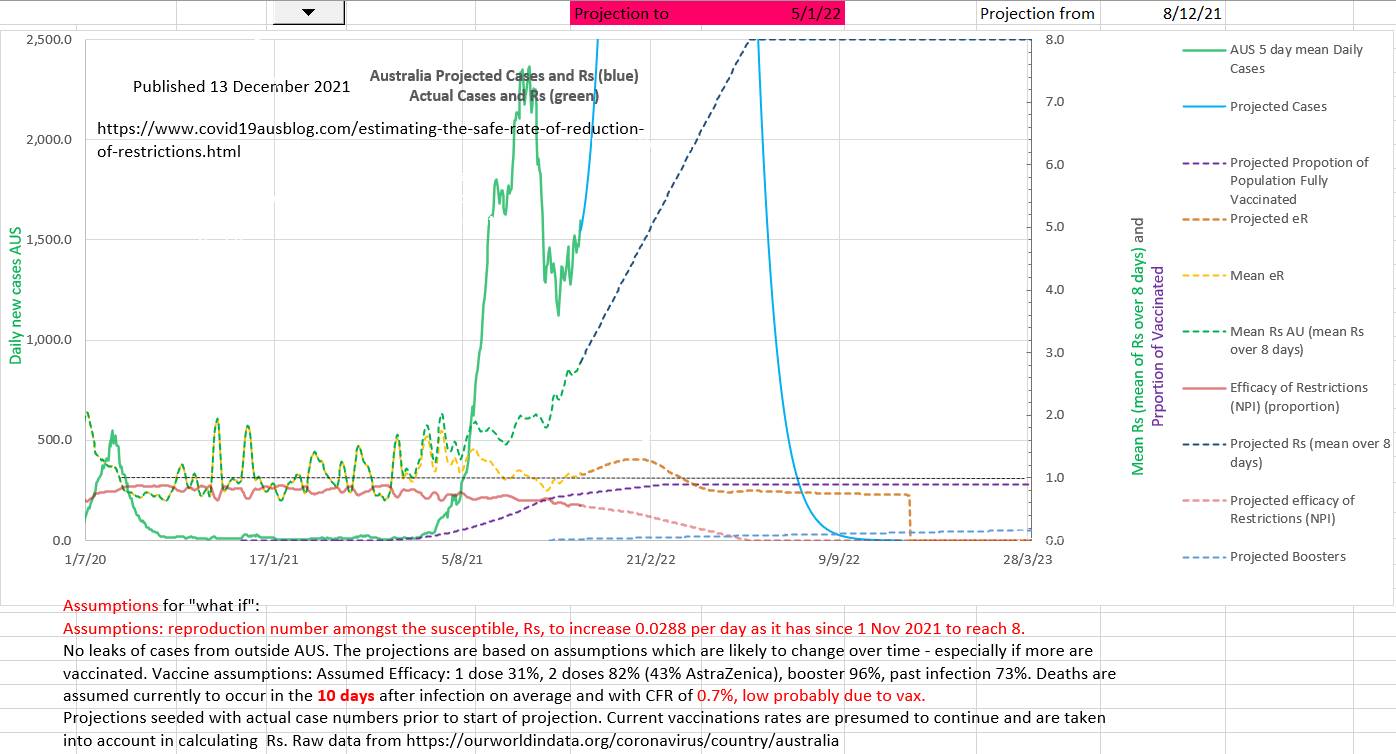
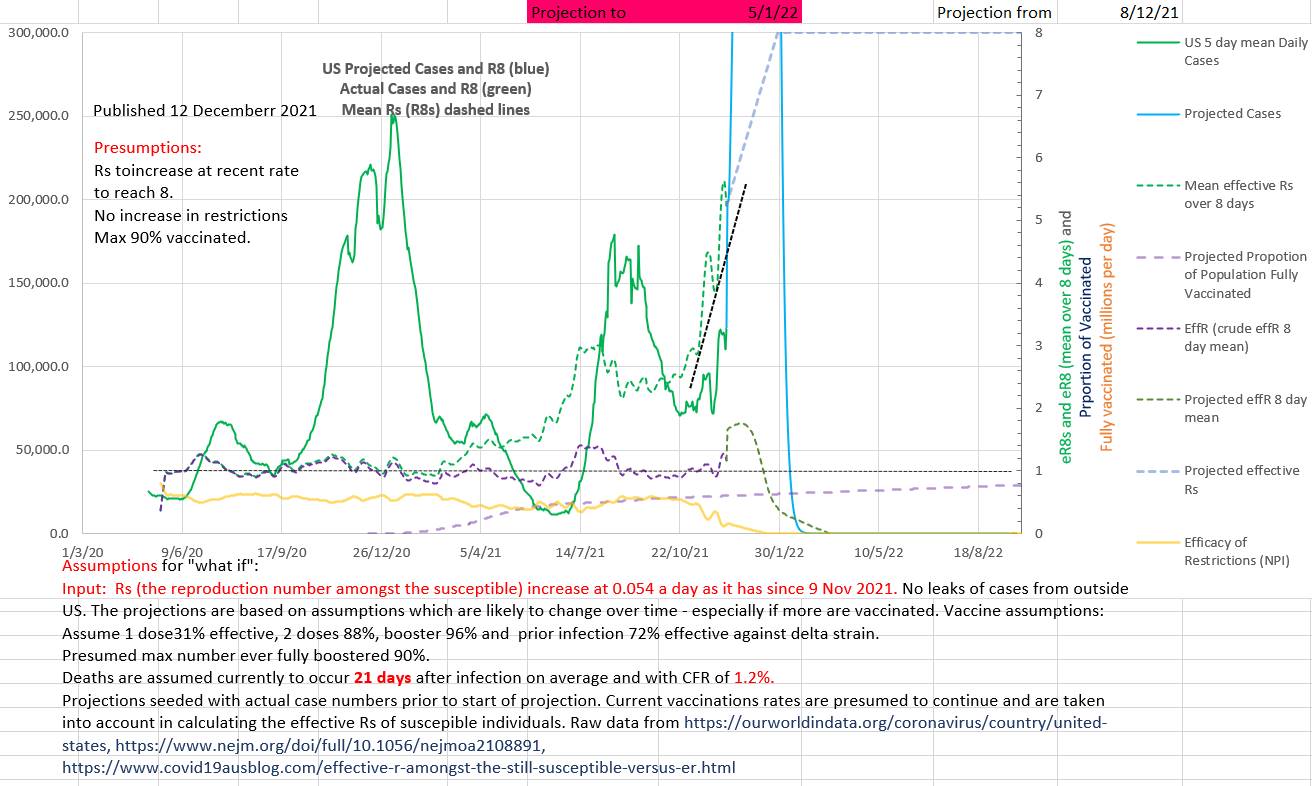
The two charts below (Australia and US) further demonstrate that Rs, the reproduction number amongst the susceptible, is an important summary statistic of the epidemic and that by comparison effR or 'effective R' may be 1 or less, giving false reassurance, while the virus is replicating exponentially amongst the still susceptible in the population. The R₀ of the virus is reduced to Rs by the restrictions (NPI) in place. Restrictions are effective only amongst the susceptible (since the virus is not replicating amongst those who are not susceptible).
Rs has recently changed to steadily increase. The the projection assumes that Rs continues to increase at the same rate to 8 (which is the currently presumed R₀ of Omicron in the absence of data). The number of new cases a day is uncertain because the reintroduction of restrictions, or not, cannot be predicted but the number of new cases a day is projected to be certainly high.
Surprisingly 22% of the Australian population remain unvaccinated and only 2% have had boosters. Perhaps vaccination and booster roll out would be better managed if heath authorities and advisers used Rs as an indicator of serious concern?
The recent rate of rise of Rs (0.0538) in the US has been double that of Australia. 40% of the population remain unvaccinated and only only 15% have received a booster.
Actual new case numbers a day cannot be accurately predicted because the response by government, States, health advisers and the population are unpredictable. But case numbers are projected to be high.
There is an unexplained feature of both the Australian and US charts. The Rs appears to have changed to increasing rapidly from 1 November and 9 Nov respectively, but Omicron has been reported to have first arrived in these countries on or about 27 November. Where restrictions eased coincidently at just the wrong time? Or was a variant present earlier?
