|
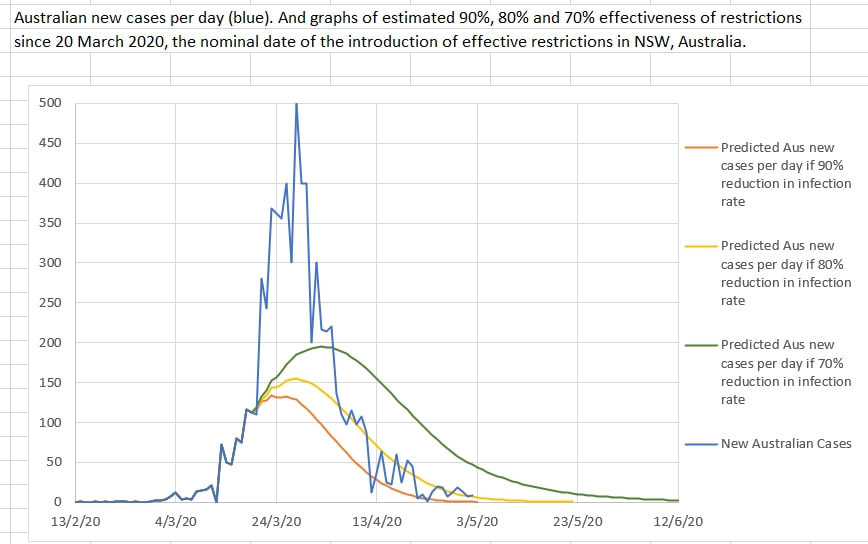
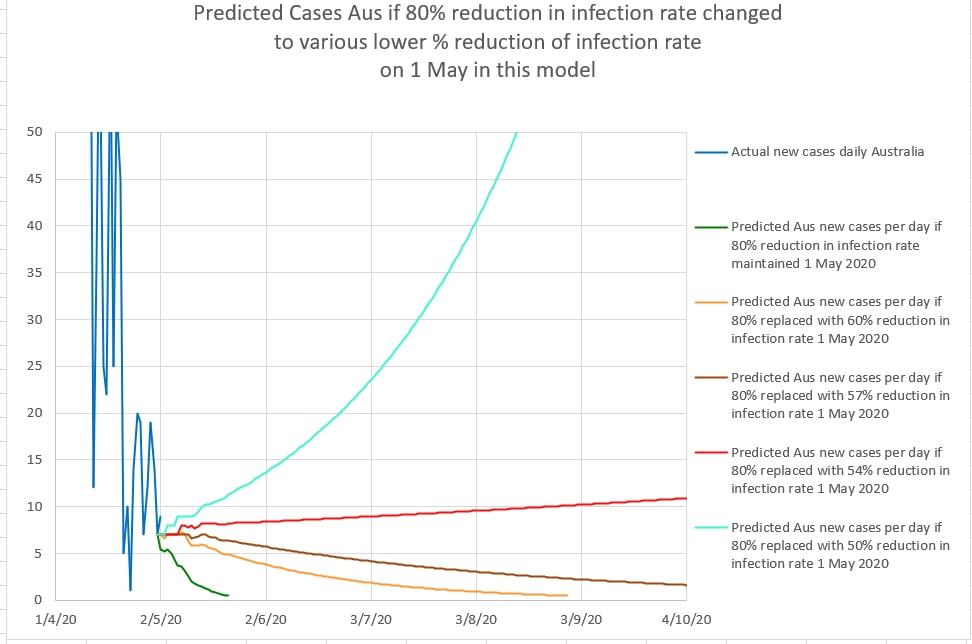
In Australia, NSW started the first stage of gradually lifting restrictions on the 1st May 2020. The change in NSW was that 'two adults and their dependent children' could visit a home. in order to monitor the effect of easing restrictions, the new cases per day can be plotted over a graph of the predicted cases for various percentage of apparent effectiveness of the restrictions. Up until 1st May it appeared that the restriction were about 80% effective in reducing the infection rate of the virus causing Covid_19. The graph below shows the model's predicted daily new cases if the easing of restrictions caused the effectiveness of restriction to reduce to various percentage effectiveness values. The model includes a 14 day logarithmic 'wash-out' of the effectiveness of restrictions from 80% to a lower percentage (each in a separate, coloured graph). The model seems to suggest that the restrictions should remain at at least 60% effectiveness to suppress the virus locally. Slightly less than 60% effectiveness results in a prolonged flat curve, and less than 54% effectiveness results in a significant second spike.
0 Comments
Leave a Reply. |
AuthorDr Michael Cole FRACP LLB Archives
September 2021
Categories |


 RSS Feed