|
Ro and infection time (i, the time a case remains infectious) are often determined empirically by case tracing and contact tracing in the field. It is usually considered difficult to estimate Ro and i from population data and models, like new and total cases. It does appear that Ro and i can be estimated graphically by plotting curves with various values for Ro and i such that the curves match the actual data of new and total cases. Restrictions were put in place in Australia on 20 March and the maximum new cases a day occurred on 28 March 2020. 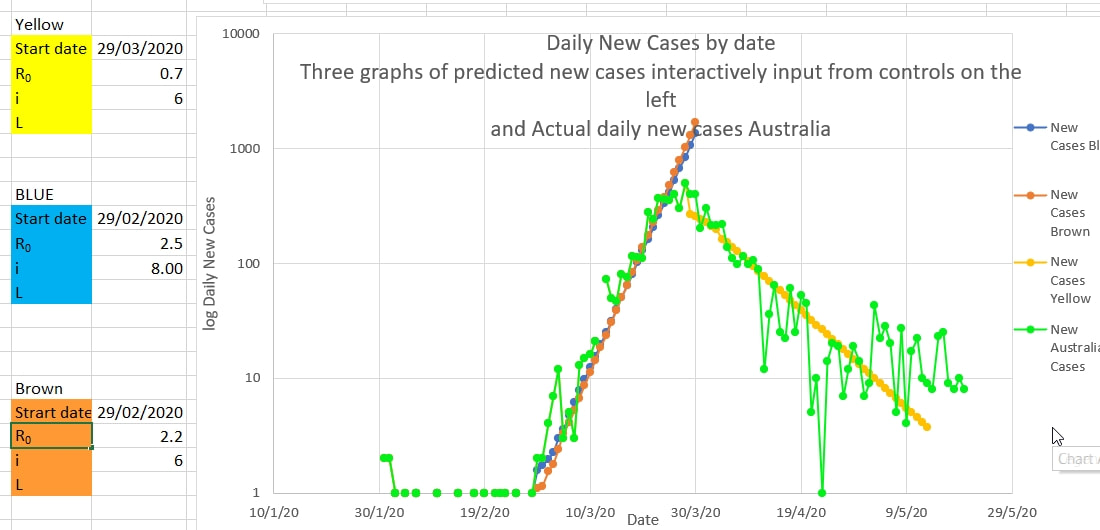 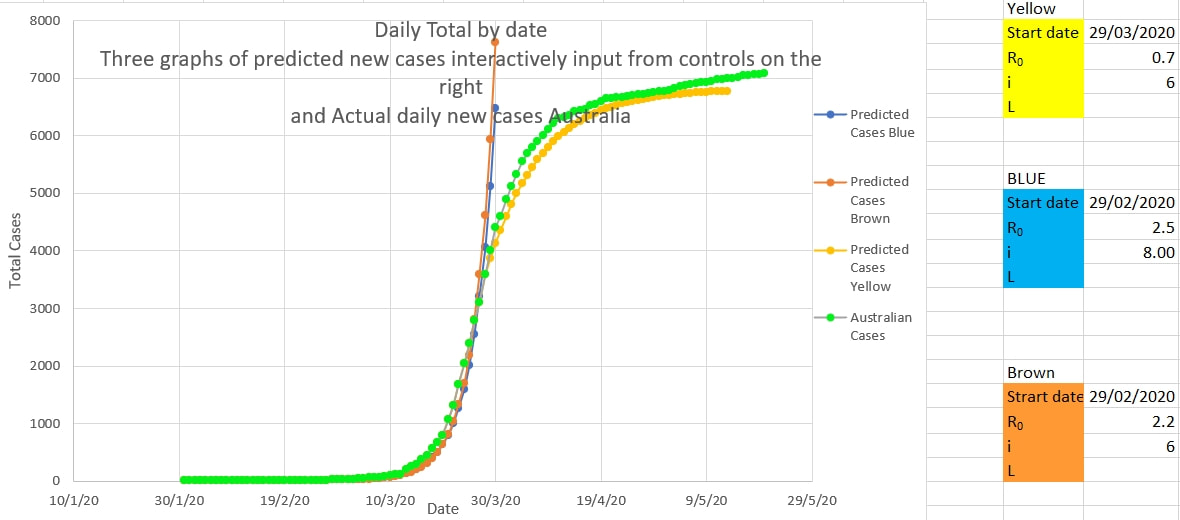 Ro and i change the slope of log new cases graph in opposite directions, so there are a number of 'sets' of Ro and i which fit the actual data equally well. It may be possible to determine which 'set' of Ro and i best agrees with the empiric field data.
Ro and i produce different shapes in the graph of the total cases near the end of the epidemic. Presumably i should have the same value in both graphs. Then R at this time can be more easily estimated and may suggest the effective R while the restrictions are in place. The efficacy of restrictions appears to be 1- 0.7/2.2 which is 68%.
0 Comments
Leave a Reply. |
AuthorDr Michael Cole FRACP LLB Archives
September 2021
Categories |
- Home
- Covid-19 US stats and projections
- The Epidemic Model
- The concept of a personal R
- Contact
- Blog
- Proportion Needed to Vaccinate
- Vaccinating Children
- Cases in Isolation to end the wave
- Model Predictions for 'opening up' in NSW
- The Case Fatality Rate (CFR) in Young Children
- Effective R amongst the Still Susceptible versus eR
- Estimating the 'Safe' rate of reduction of Restrictions
 RSS Feed
