|
The number of new cases in Australia is falling, but falling less than required. The current mean R is 0.87 which is perilously close to the critical epidemic value of 1. And at the moment R is rising. These numbers probably signal a risk of another cluster or possibly the start of a third wave. What a pity that the low number of new cases seems to always make people and the government relax just at the time they should be holding firm and driving new cases towards zero and keeping the mean R low. Instead of falling the mean R has stayed the same or risen since 27th August 2020. The mean R has not dropped for 5 weeks (blue horizontal arrows on the chart below). It only requires a few members of the population to be non-compliant with restrictions for there to be a potential pathway connecting them up. If any one of them gets the virus then all of them get the virus and so a cluster starts and spreads. 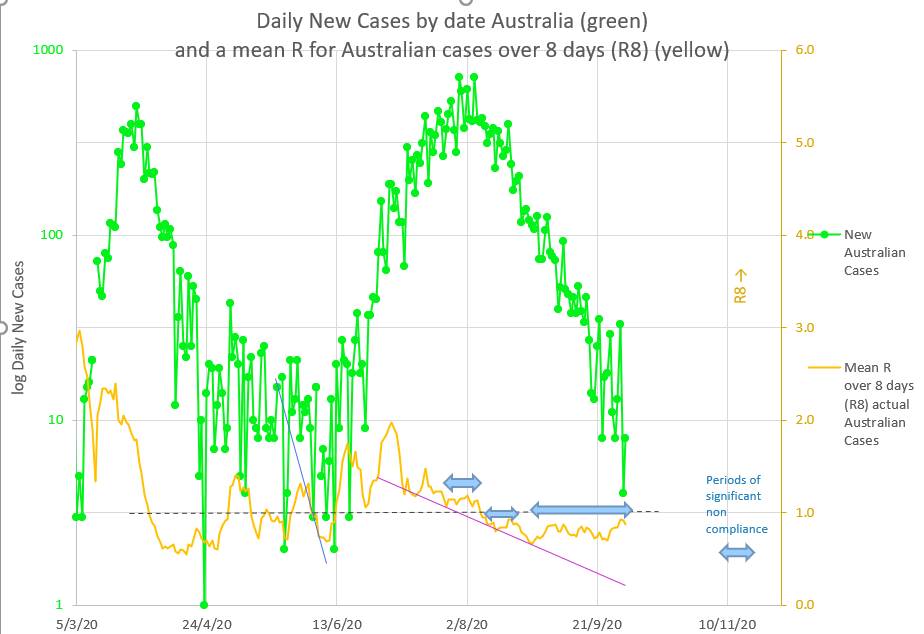 In the past a new cluster or new wave started each time the mean R was rising and approaching 1 (the blue vertical arrows on the chart below). When the mean R becomes 1 it means there are one or more pathways or network connecting non-compliant individuals together in such a way as to make it possible for each infected person to infect one further person. If anyone in the pathway or network is even less compliant then they can catch and spread the virus more easily and the mean R will rise. At that point there is a new cluster or new wave starting. Maybe NZ and QLD are right that this is not quite the time to ease restrictions. It is probably the time to lessen non-compliance in those few who contribute to the rising mean R. Mean R probably does not lie. 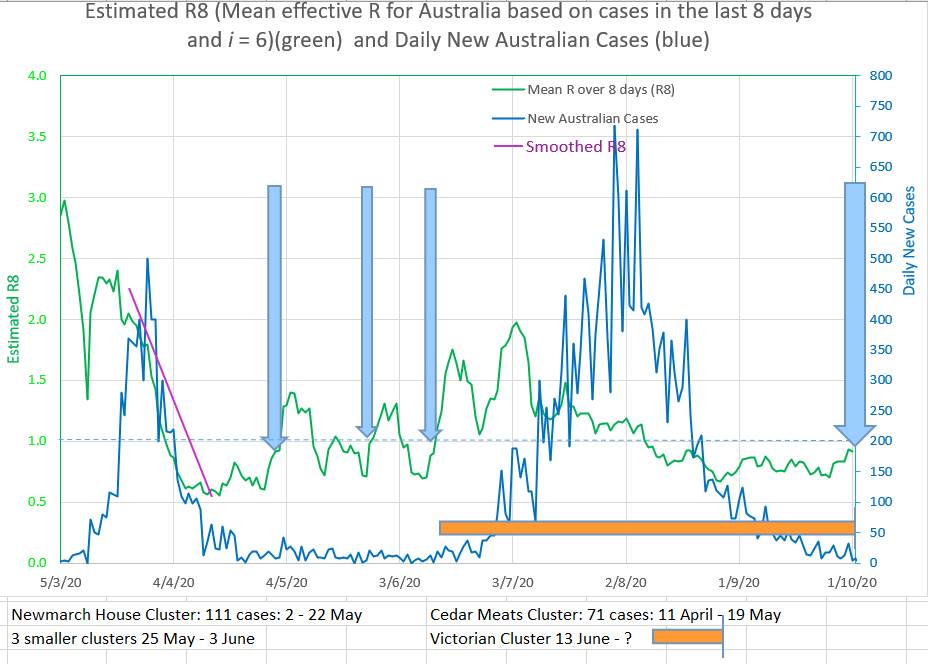 As a side issue: What is the meaning of R or mean R?
At its base, R, or a mean of R over a few days, represents the number of individuals infected by one infected individual. It seems common for an individual to be considered infected until they can be removed to the recovered or dead groups. In practice, though, an individual is only infectious until they are removed from the population by by the authorities by isolation or hospitalisation. After that they should not often be able to infect anyone. Thus R should represent the number of individuals infected by one Infecting individual. Not 'infectious' individual. That is by one individual who is potentially infecting others. Once the individual is isolated they may still be infectious but they are not infecting others and therefore do not contribute to the value of R. But at a less granular level, R may be a property of each individual (say Ri) in the population and may measure that individual's risk of catching the virus and of infecting others. Thus some individuals would have a low Ri and others would have a high Ri. Some might have an Ri of 0.2 and be of low risk of catching or transmitting the virus, while others may have an Ri of 2 and have a high risk of catching and transmitting the virus. Ri would probably have a 'normal' distribution. Thus there would be high Ri individuals in the population even if the mean R was relatively low. So there would be individuals with an Ri of 2, for example, in a population whose mean R was 0.5 An individual's Ri would be increased by living in a big family, sharing a dwelling with many others, for example a care facility or dormitory, working in an environment where isolation is difficult or in which the virus thrives, for example the cold room in a meat works, visiting pubs and clubs and shopping centers where many individuals meet, visiting many contacts, traveling on public transport, being careless with social distancing and hand-washing, being non-compliant with restrictions and being unable to understand. An individual's Ri would be decreased by living alone or with a few, staying home, keeping contacts to a minimum, not travelling on public transport, being careful with social distancing and hand-washing, being compliant with restrictions and by understanding the issues at play. Ri measures an individual's risk of catching or infecting others with the virus. A person with a high Ri is in contact with more individuals than a person with a low Ri and therefore with more high Ri individuals. Thus there is likely to be a pathway or network joining high Ri, or high risk, individuals together. As long as no one on the pathway or network catches the virus, nothing happens. Once one person on the pathway or network catches the virus there is already the potential path through which it infects the others on the pathway or network. And 'nothing happening' turns to a cluster in a short time. The concept of Ri may explain the fact that R does not fall quickly when restrictions are introduced as would be expected. Instead R follows a flat reverse S shape, but mainly follows ,a linear decrease over the course of the cluster or wave. The concept of Ri would suggest that many individuals would rapidly reduce their risk by reducing their Ri by following restrictions and infection control measures. But others would be less compliant or risk adverse and would not reduce their risk, Ri, to the same degree. Hypothetically the virus would continue to spread through these high risk networks. The observed R would be high because only those catching the virus or infecting other individuals contribute to the observed R in the population. R is the number of new infections on a day divided by the number of infecting individuals who have not yet been isolated. The rest of the population does not contribute to R in any way. As the cluster or wave continues two thing may happen. First, individuals may reduce their Ri further. Second, higher risk, high Ri, individuals are removed from the population by being infected leaving individuals who are high Ri, but not as high as the removed individuals. So the virus would still spread, but not as vigorously as before. The observed R would decrease. And the observed R would decrease slowly to a low value towards the end of the cluster or wave. Unfortunately, human behaviour being what it is, there is a tendency to ease up on compliance once the perceived danger is over. That is, before the virus is eradicated in the community. At that stage single community cases at intervals of less than 6 days signals the presence of networks of individuals with Ri of 1 or more, resulting in an observed R of 1. That is at the critical R for the start of a cluster or wave. (curve matching of Australian cases suggests that individuals are isolated after 6 days and play no further part in infecting others. One case ever 6 days suggests that one case is still infecting one other individual before being isolated and therefore the R is 1). Summary: A low number of community cases is not a good number of cases to be easing restriction on. An apparent R rising and approaching 1 is not a good time to be easing restrictions. Aim for zero community cases. An observed R of 0.6 or less is much safer than an R of 0.8 and higher. No value of R is completely safe. R is a summary value representing only those just infected and those who did the infecting. It is mathematically unconnected to the rest of the population. It is an assumption that the observed R represents a characteristic of the whole population. The concept of Ri is that Ri is a statistic of each individual in the population and is a summary measure of that individual's risk of catching and transmitting the virus. Each individual has a number of contacts. Potential pathways or networks for viral spread exists between individuals with high Ri. Early in a cluster, networks of high Ri individuals are more likely to spread the virus. Later, networks of lower Ri individuals will become more prominent. The concept of Ri suggests that the assumption that the observed R represents a characteristic of the whole population is not correct. Herding humans is as difficult as herding cats.
1 Comment
|
AuthorDr Michael Cole FRACP LLB Archives
September 2021
Categories |
- Home
- Covid-19 US stats and projections
- The Epidemic Model
- The concept of a personal R
- Contact
- Blog
- Proportion Needed to Vaccinate
- Vaccinating Children
- Cases in Isolation to end the wave
- Model Predictions for 'opening up' in NSW
- The Case Fatality Rate (CFR) in Young Children
- Effective R amongst the Still Susceptible versus eR
- Estimating the 'Safe' rate of reduction of Restrictions
 RSS Feed
