|
updated 21 September 2021 The Case Fatality Rate (CFR) in Australia appears to be at a low rate of 1.3%. About the same as the US. Not surprisingly the CFR was high in many countries early on in the pandemic before treatment was refined, resources mounted and older groups vaccinated. What is surprising is that the CFR was comparatively high during the second wave (Vic). The overall CFR% during the second wave appears to have been 4.0% and at time reached 6.0%. The clusters in aged care and lack of vaccine may explain the higher CFR The changed CFR in Australia makes it difficult to extrapolate projected deaths in particular age groups based on earlier data, because the CFR is currently low, whereas earlier data includes periods when the CFR was higher. 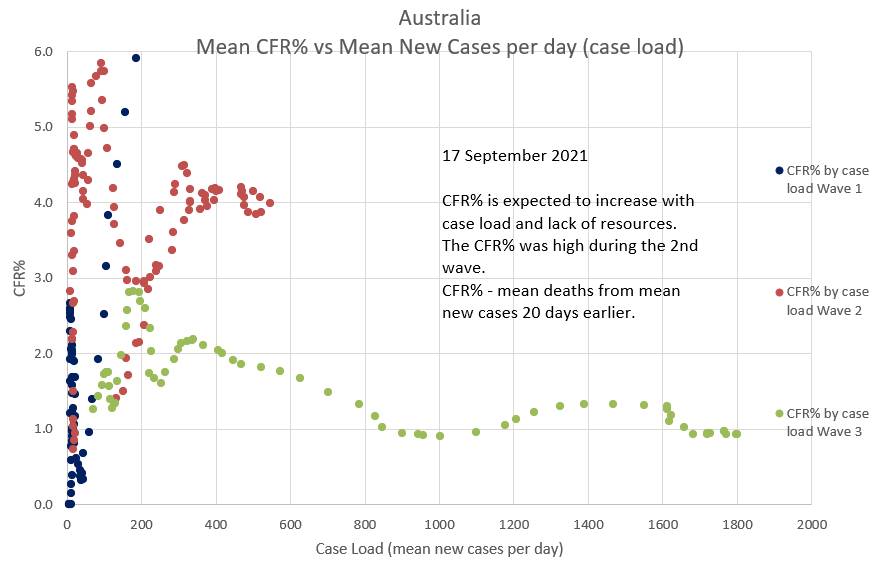 The CFR% and lag time between diagnosis and death can be estimated by plotting projected deaths, using a suggested CFR% and lag time, against the actual deaths. The two will only superimpose when the 'suggested' CFR% and lag time are consistent with the those of the actual deaths. Various 'suggested' CFR%s and lag times can be entered into the green box to the left of the chart in an effort to make a portion of the green graph superimpose the relevant portion of the blue graph. The graphs below suggest that the during the current (Wave 3) in Australia CFR% is 1.3% (0.013) and the lag time between diagnosis and death is 20 days. (Reported data is used, but there is a delay before infection and death are reported). 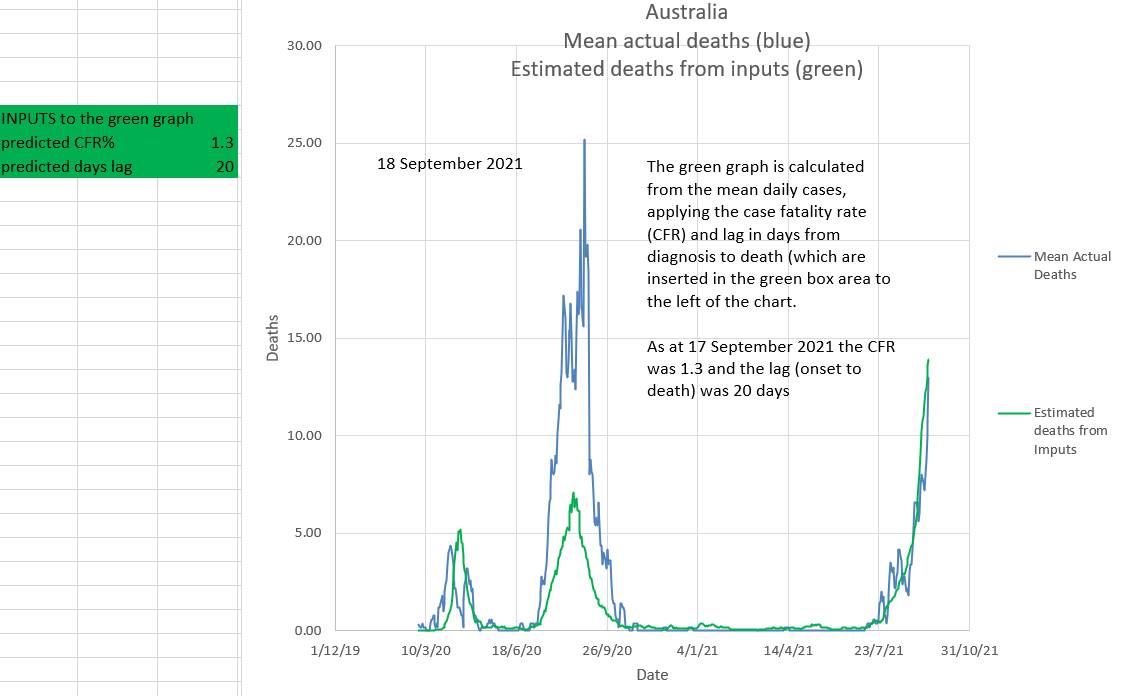 In Australia it appears that during an epidemic wave the effective R (effR), or its mean over 8 days, (R8), goes down slowly. It does not appear to 'wash in' as has been suggested. It may be due to a 'network effect' where the virus initially spreads through individuals with behaviours that can be conceived as having a high 'personal R' (Rp). Later these individuals spread the virus to individuals who have low personal Rs (low Rp) and who do not re-spread the virus. Then the effR (or its 8 day mean, R8) would indeed reduce slowly after restrictions are applied. On the other hand, if individuals anticipate freedom from restrictions they may become less compliant with restrictions causing an increase in effR. This appears to have happened in NSW where an initial slow reduction in effR gave way to a sudden large increase in effR just as a 'road map out' related to vaccine targets was mooted. There was also a slight decrease in daily vaccination rates. In the chart below the 'projected R8' or 'projected effR' is used to drive the projections in the graphic. In reality it is the other way around; the effR is derived from the data. However projected R8 can be conceived as a 'summary' of all the many factors which play a part in driving the epidemic. In this way various suggested effRs can be used to estimate the outcome with regards to new daily cases. The calculation includes the effects of one and two doses of vaccination. 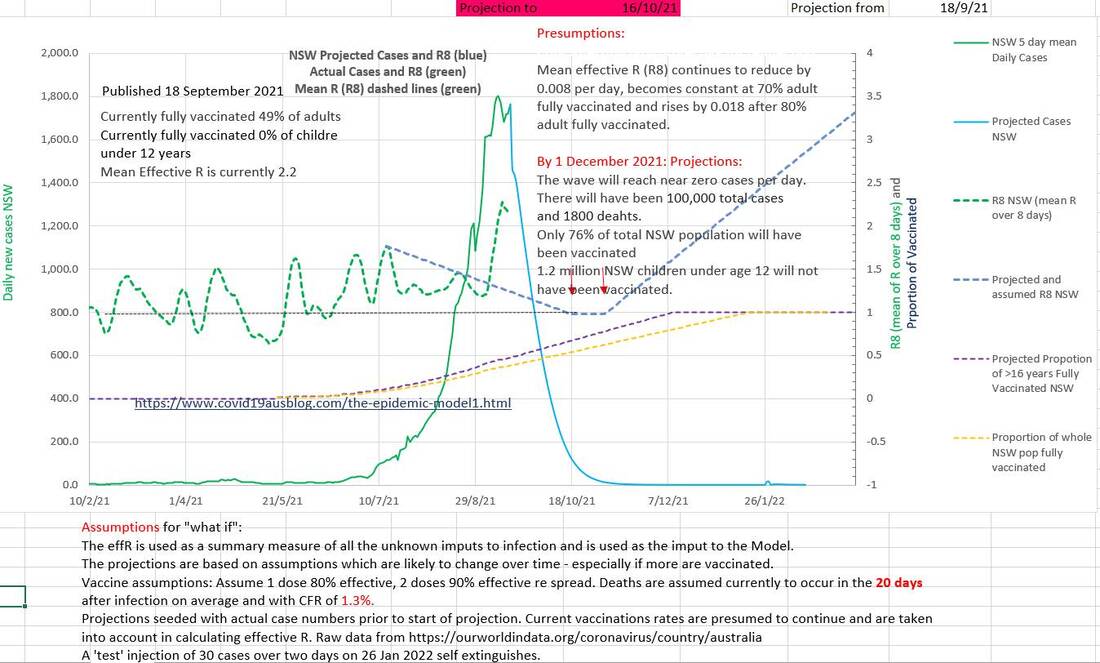 Cumulative deaths are projected to be 1800. 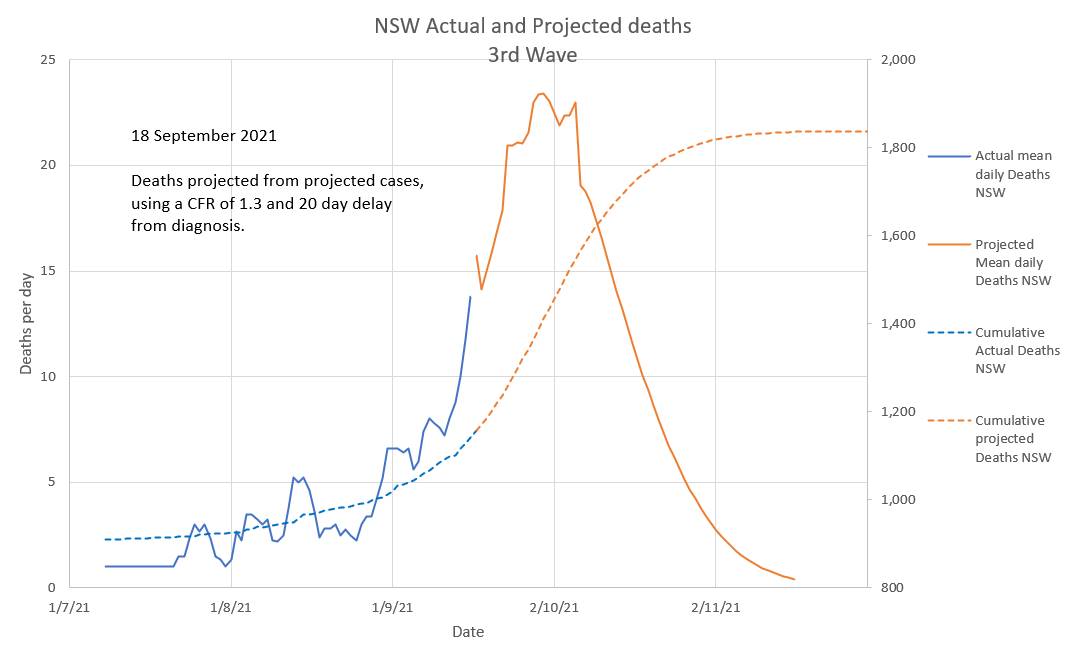
0 Comments
Leave a Reply. |
AuthorDr Michael Cole FRACP LLB Archives
September 2021
Categories |
- Home
- Covid-19 US stats and projections
- The Epidemic Model
- The concept of a personal R
- Contact
- Blog
- Proportion Needed to Vaccinate
- Vaccinating Children
- Cases in Isolation to end the wave
- Model Predictions for 'opening up' in NSW
- The Case Fatality Rate (CFR) in Young Children
- Effective R amongst the Still Susceptible versus eR
- Estimating the 'Safe' rate of reduction of Restrictions
 RSS Feed
