|
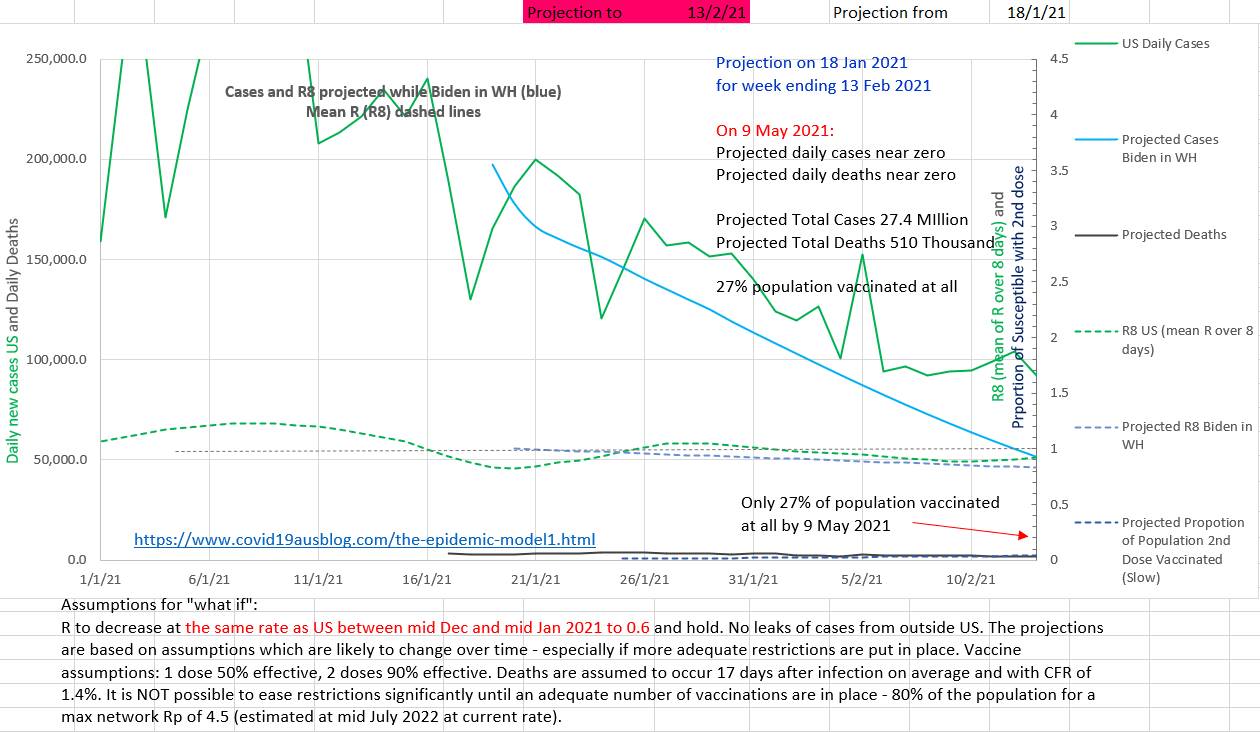
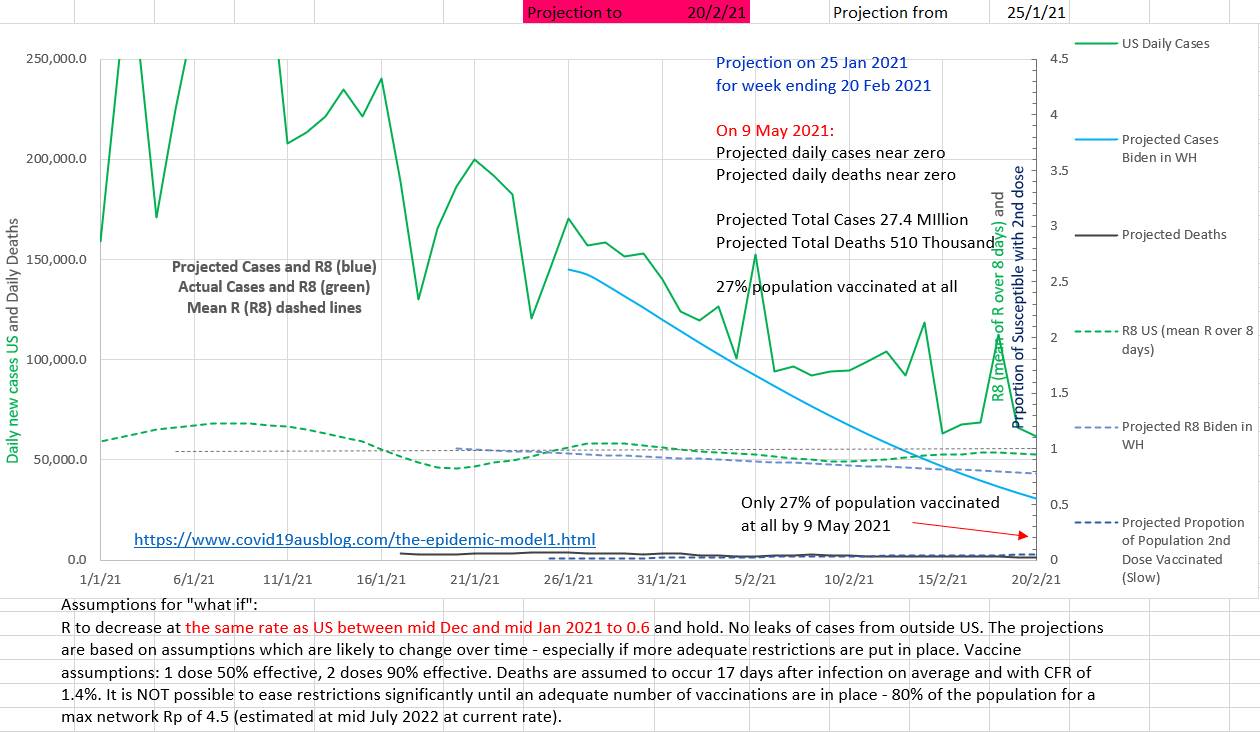
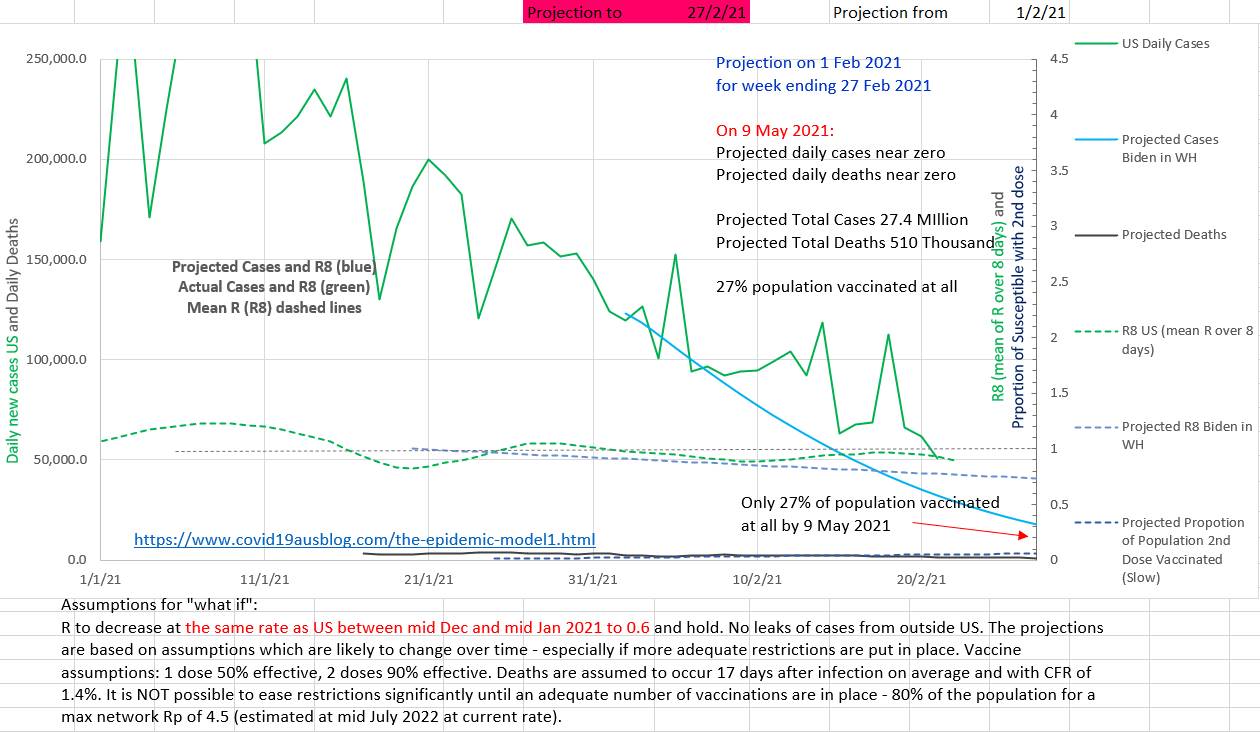
The proposed epidemic model here was used to make weekly projections 4 weeks ahead. The model was 'seeded' with the actual past and current case, death, and vaccination numbers. The model appears to perform reasonably well compared to CDC published projections of future cases and deaths. The projection (blue) that was made for the week ending 13 Feb 2021 is shown below with the actual cases which have occurred since (green) superimposed. Effective R and Cases fell slower than expected (which was a fall in R at the rate it fell mid Dec 2020 to mid Jan 2021. The projection (blue) that was made for the week ending 20 Feb 2021 is shown below with the actual cases which have occurred since (green) superimposed. The assumed fall in R turned out to be an overestimate. The model is 'seeded' with the actual cases which occurred prior to the start of the projection. So the initial part of the projection is always similar to the actual cases that precede it. Thereafter the curve is generated by the model. Cases that occur after the start of the projection are not used in the model's projection; they are included here to compare the projection with the actual result. In the long term, at this rate of fall of R, the local US cases are projected to be near zero by 9 May 2021. But note that projected deaths are projected to be up to 10 thousand more than the 13 Feb 2021 projection, due to the slow decline in actual cases and effective R. The projection (blue) that was made for the week ending 27 Feb 2021 is shown below with the actual cases which have occurred since (green) superimposed. The actual cases which occurred are superimposed on the projection for comparison. Only the actual cases that occurred prior to the start of the projection (prior to 1 Feb 2021) are used to 'seed' the projection. It appears that the fall in effective R of 0.007 per day used in the above projections was an over-estimate of the fall. The rate of fall of R in February 2021 is more likely to represent the actual future fall in R; that is a fall of 0.00427 per day in effective R. It is a disappointingly slow fall considering that it is the fall in R, produced by social distancing and other public health measures, that lowers cases and saves lives in this early phase of eradicating the epidemic.
0 Comments
Leave a Reply. |
AuthorDr Michael Cole FRACP LLB ArchivesCategories |
- Home
- Covid-19 US stats and projections
- The Epidemic Model
- The concept of a personal R
- Contact
- Blog
- Proportion Needed to Vaccinate
- Vaccinating Children
- Cases in Isolation to end the wave
- Model Predictions for 'opening up' in NSW
- The Case Fatality Rate (CFR) in Young Children
- Effective R amongst the Still Susceptible versus eR
- Estimating the 'Safe' rate of reduction of Restrictions


 RSS Feed
