|
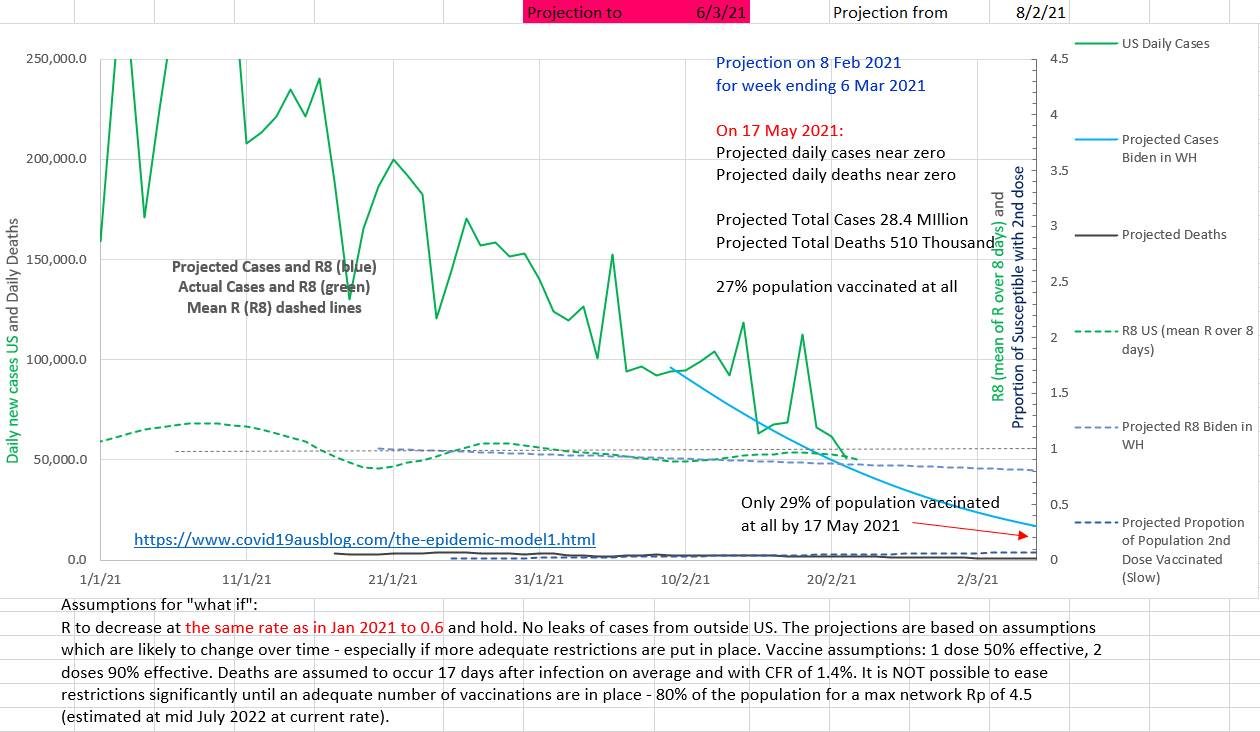
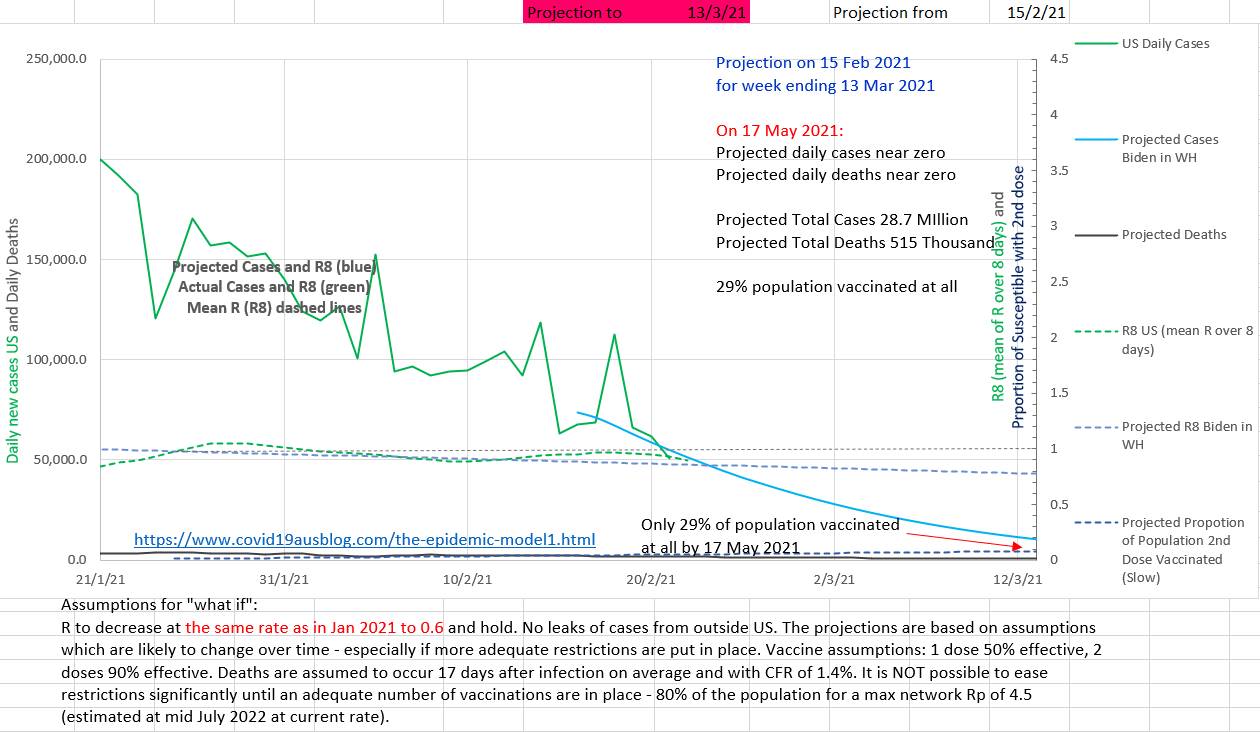
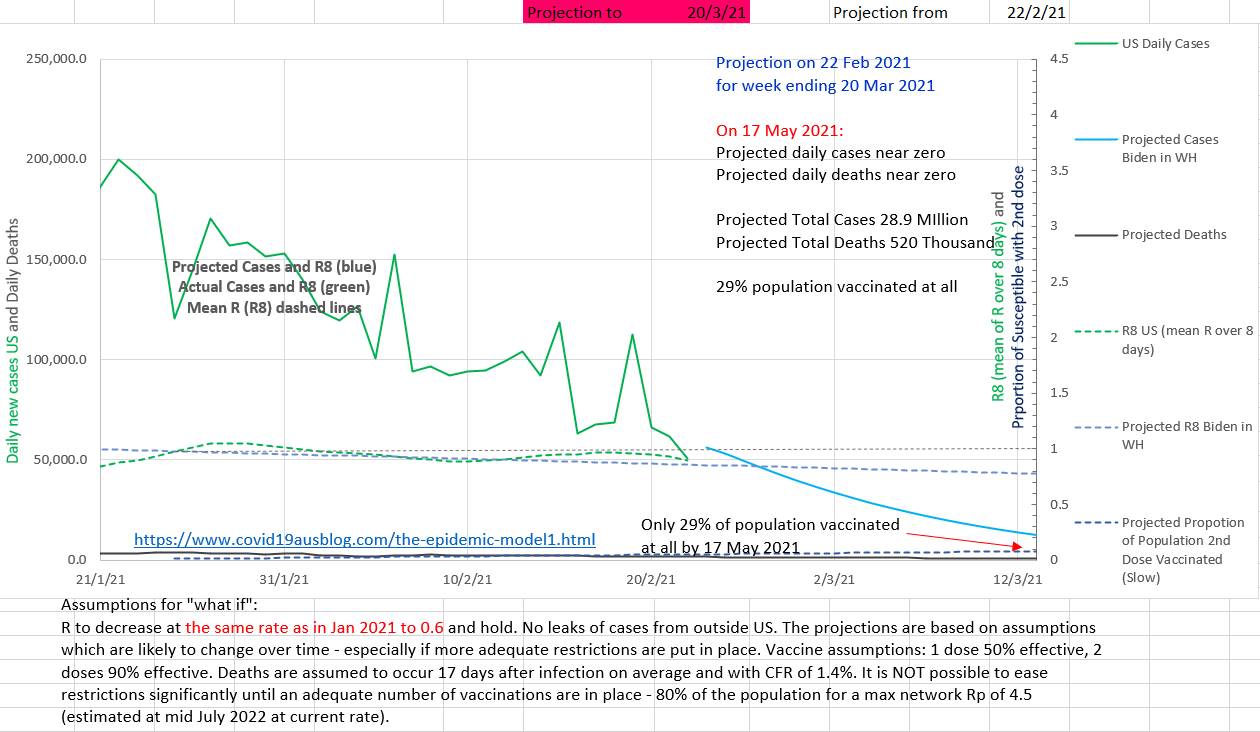
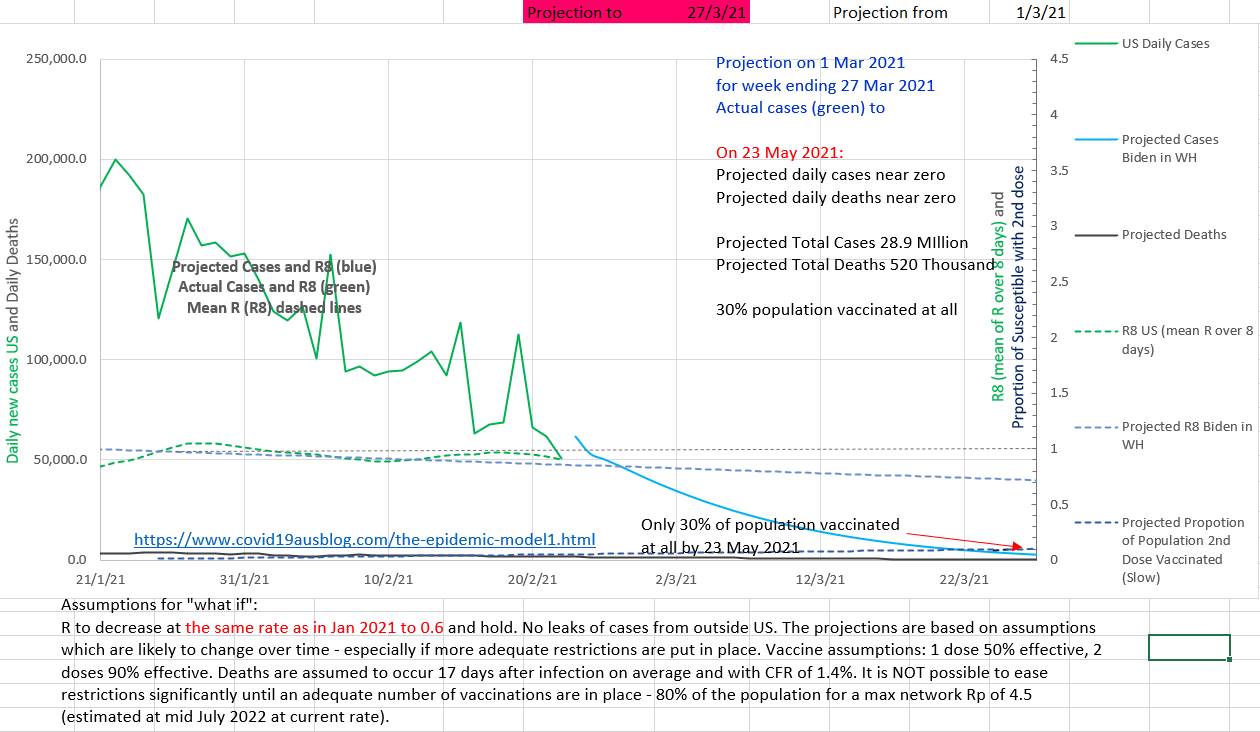
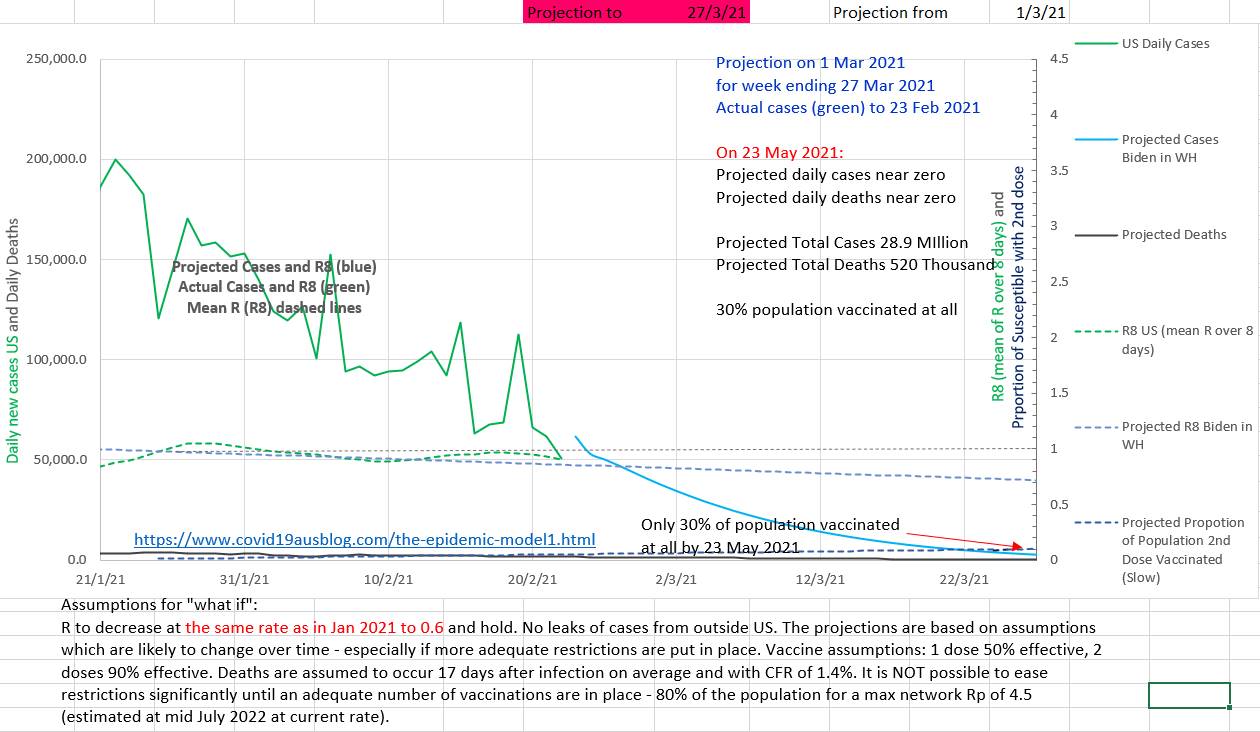
The proposed epidemic model here was used to make weekly projections 4 weeks ahead. The model was 'seeded' with the actual past and current case, death, and vaccination numbers. The model appears to perform reasonably well compared to CDC published projections of future cases and deaths. In the projections for February the assumed fall effective R was over estimated. It appears that a fall of only 0.00427 in effective R should be used for projections of US cases and deaths. The slower decrease in effective R is projected to result in up to 1 million extra cases and a later date of 17 May 2021 for there to be near zero cases. Because of this delay 2% more people will have received at least one dose of vaccine. The proposed epidemic model here was used to make weekly projections 4 weeks ahead. The model was 'seeded' with the actual past and current case, death, and vaccination numbers. The slower decline in effective R than in previous projections results in up to 5,000 extra deaths in this projection. The projection for the week ending 20 March 2021 suggests 28.9 million cases and 520 thousand deaths by 17 May 2021 when projected cases and deaths will reach near zero. When case numbers are low, projections break down because leaks of cases from other counties begins to outnumber local cases and the local cases become influenced by by the random behaviour of a few individuals. This Model projects that on 27 March 2021 there are projected to be 2900 cases a day (cumulative cases 28.944 thousand) and 240 deaths a day (cumulative 521 thousand deaths). Near zero cases are projected to occur on about 23 May 2021. The figures on the chart are conservative.
0 Comments
Leave a Reply. |
AuthorDr Michael Cole FRACP LLB ArchivesCategories |
- Home
- Covid-19 US stats and projections
- The Epidemic Model
- The concept of a personal R
- Contact
- Blog
- Proportion Needed to Vaccinate
- Vaccinating Children
- Cases in Isolation to end the wave
- Model Predictions for 'opening up' in NSW
- The Case Fatality Rate (CFR) in Young Children
- Effective R amongst the Still Susceptible versus eR
- Estimating the 'Safe' rate of reduction of Restrictions
 RSS Feed
