|
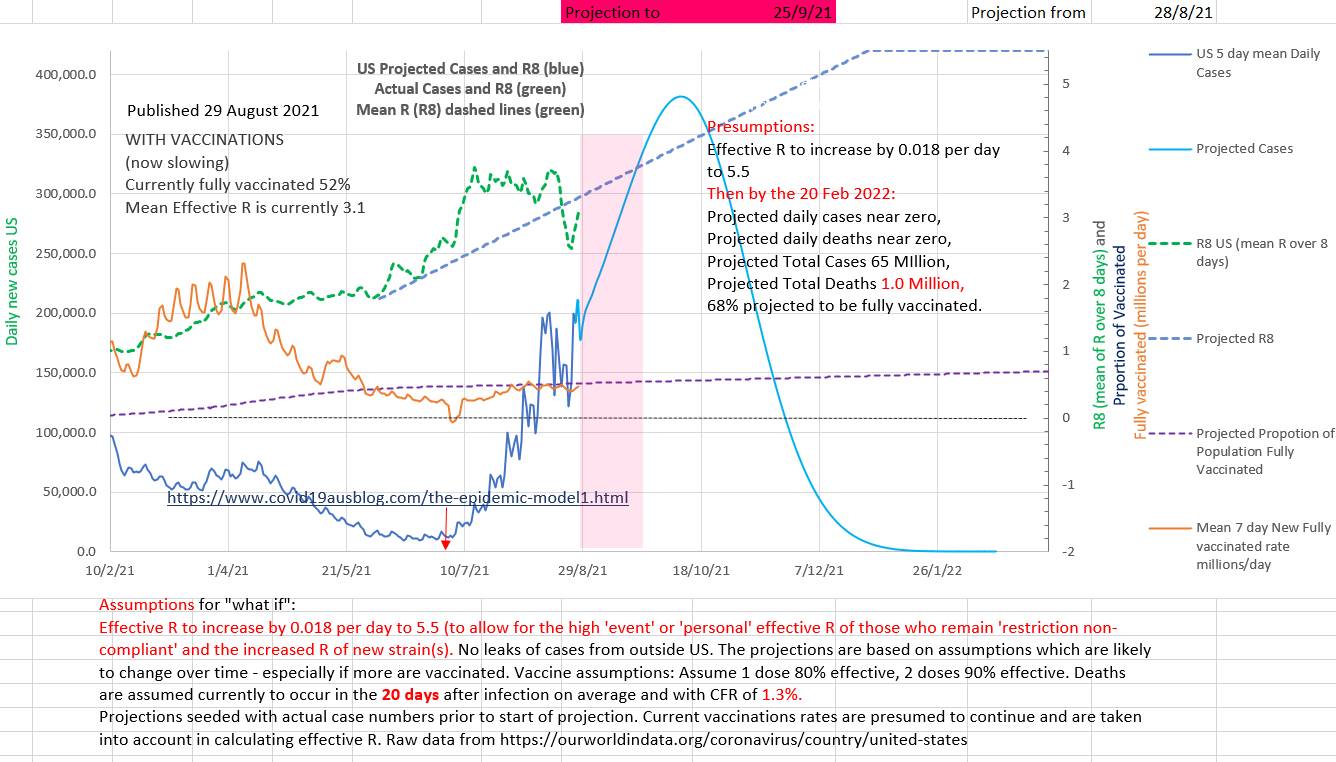
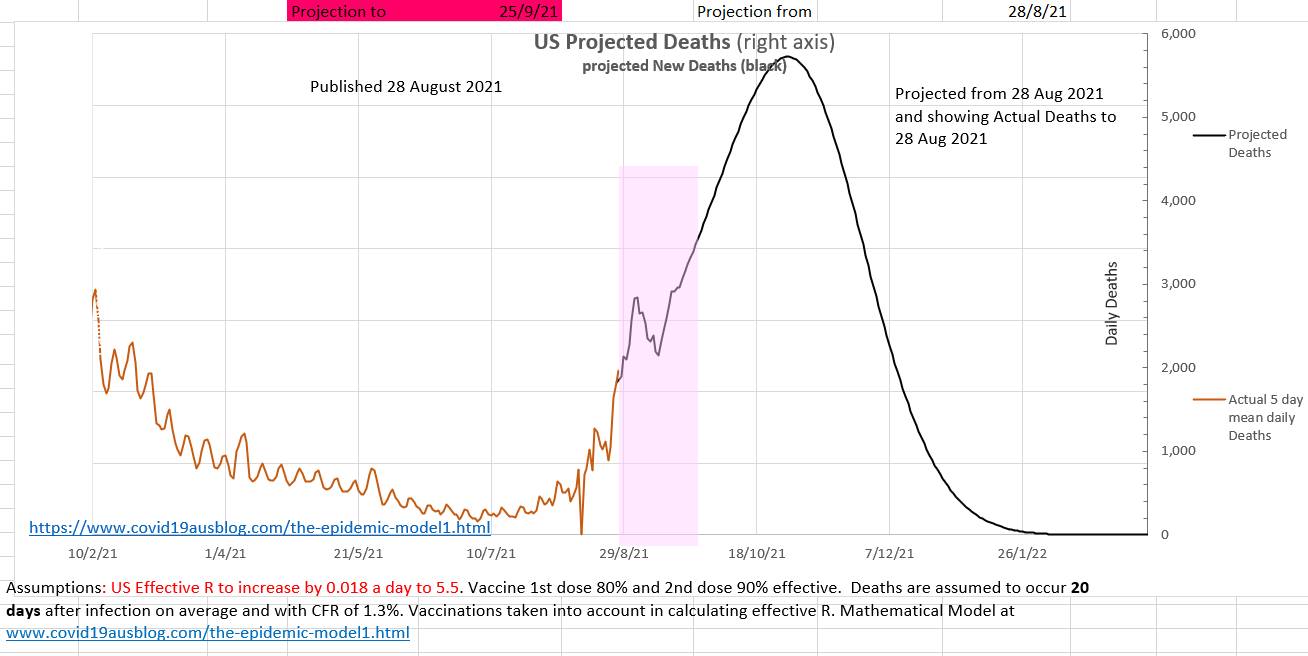
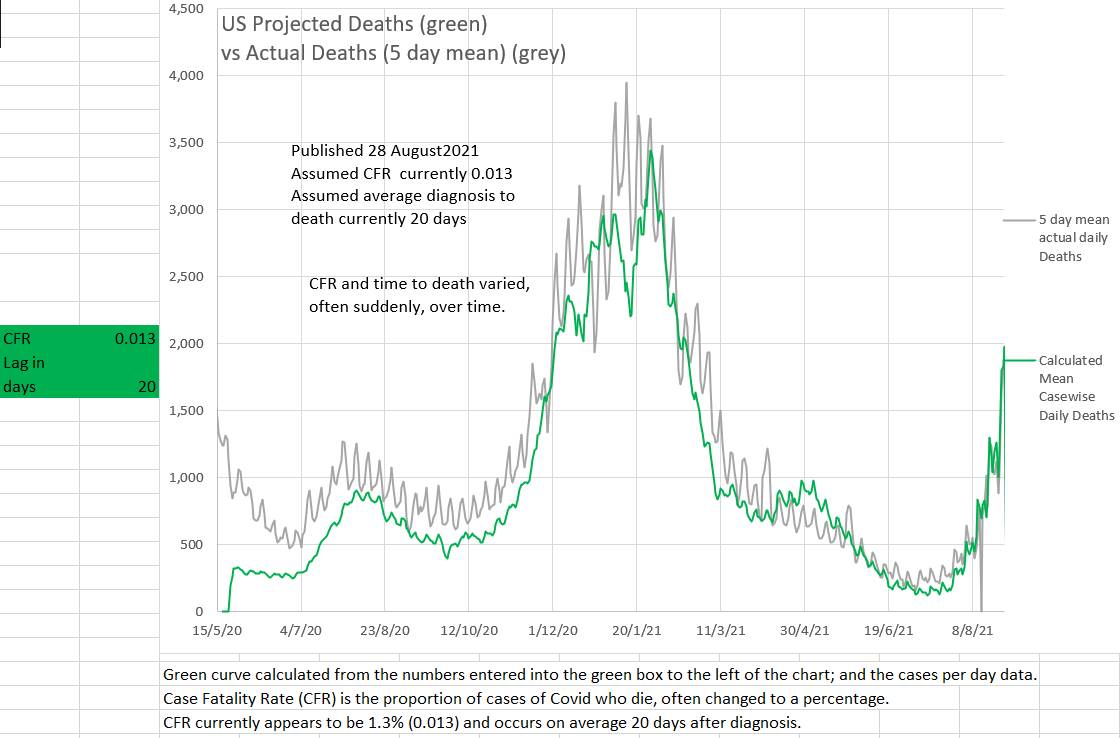
Surprisingly, since the US is experiencing a major wave, vaccination rates are slow and some state governor are arguing in supreme courts that various types of restrictions cannot be enforced. If the current trend continues our model projects over 350,000 new cases a day in October 2021 and 51 million total cases and 1 million total deaths by 20 February 2022. Some states already report that they are running out of supplies and available beds in hospital (eg https://www.texastribune.org/2021/08/27/texas-schools-covid-19-cases/amp/) . Currently the effR is 3.1 and 52% of the population is fully vaccinated. Unless vaccination rates or restrictions increase the epidemic of deaths are projected to increase by our model, perhaps peaking at over 5,000 a day in November. The grey graph below shows the 5 day mean of the actual daily deaths. A suggested case fatality rate (CFR) and average days from diagnosis to death can be entered in the green box on the left. The suggested values can be changed in the green box until the green graph best matches the grey graph of actual cases. When the green graph matches the grey graph near today's date, then the CFR and days to death in the green box are the current CFR and days to death. Various values for CFR and days to death (CFR from 1.3 to 1.7 and days to death from 17 days to 21 days) have been used to make the green graph fit the grey graph for other time periods.
0 Comments
Leave a Reply. |
AuthorDr Michael Cole FRACP LLB Archives
September 2021
Categories |


 RSS Feed