|
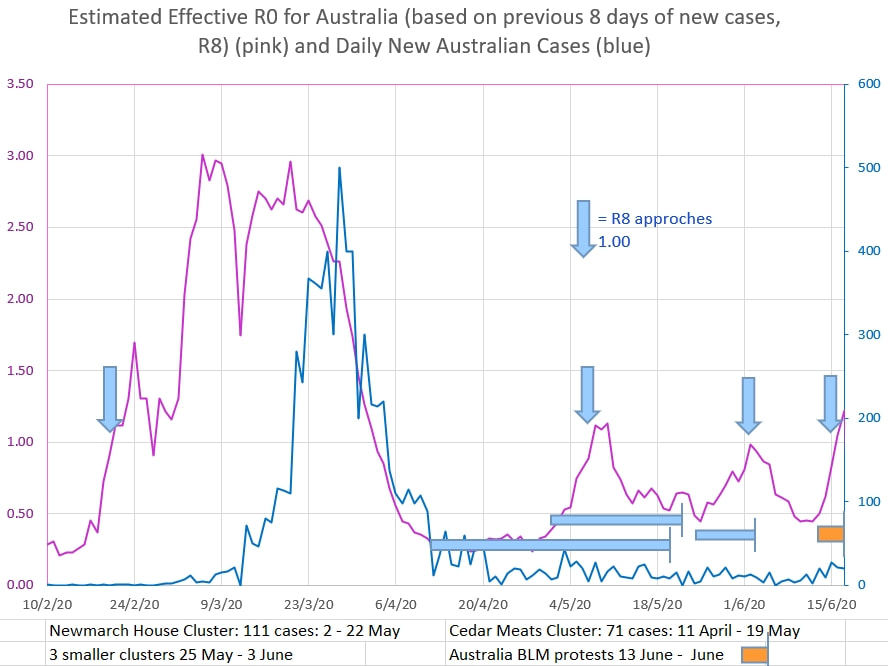
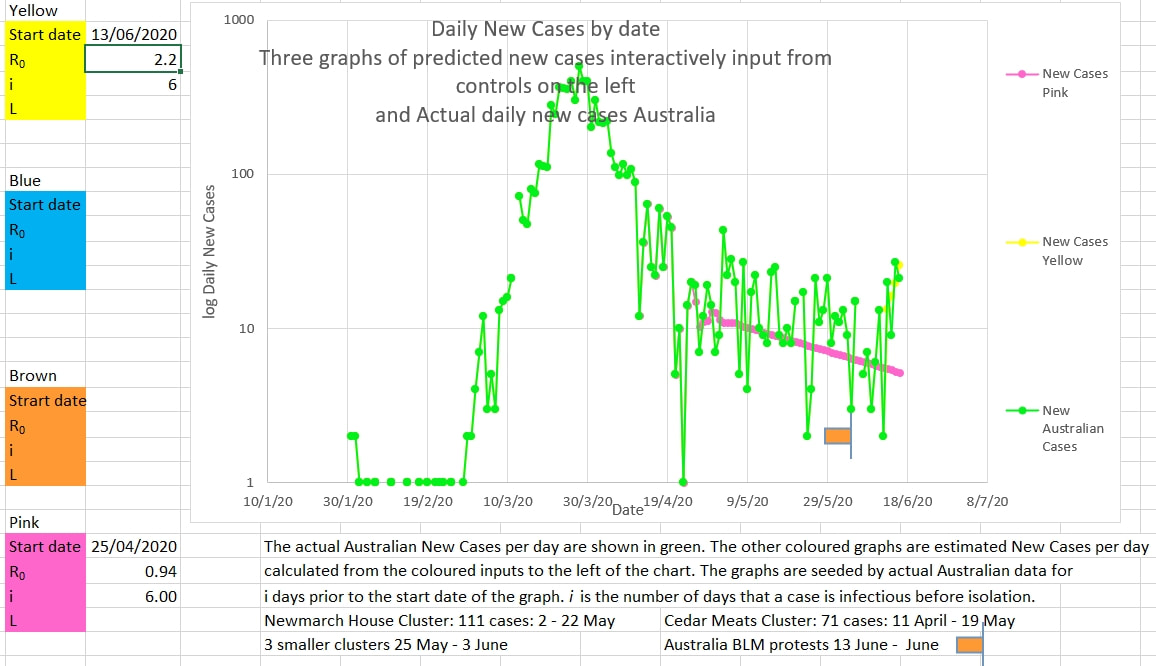
The Black Lives Matter (BLM) protests in Australia were held on and after 13 June 2020. Many protesters wore masks and some maintained social distancing. Never the less the number of people involved was outside the prescribed limits for gatherings during the viral crisis. But is there any evidence of a cluster of cases related in time to the demonstrations? The effective R0 of the virus in the population has been estimated over the previous 8 days (R8) in the pink graph below, using the model here. Arrows mark where R8 neared a value of 1.00 in the past; at the start of the epidemic, for a cluster at a meat works and for a period that had three smaller but almost simultaneous clusters. R8 appears to have neared and now exceeds slightly 1.00. Potentially this is the start of a new cluster. (shown by the orange bar). The graph below shows the new daily Australian cases in green (log axis). For comparison, graphs in pink and yellow have been superimposed using the values for R0 and i input into the boxes to the left of the graph in such a way as to mimic the slope of the Australian new cases graph.. The similar slope of the Australian new cases to the pink graph suggests that the Australian cases were showing an estimated R0 of under 1.00, and the cases were infectious for 6 days on average.
The slope of the yellow graph from 12 June to today suggests the Australian new cases are showing an estimated R0 of 2.2 and that cases are infectious for 6 days on average. However, there are only 5 data points in that series so far; too few to draw any conclusion at all.
0 Comments
Leave a Reply. |
AuthorDr Michael Cole FRACP LLB Archives
September 2021
Categories |


 RSS Feed