|
'Curve fitting' onto the graph of new Australian cases below definitely suggests that the estimated effective infection rate R0 of the virus is 1.3 or more. It is epidemic in nature. And it is time for a return to the previous levels of lockdown for those who, without fault, live where the virus is currently spreading. And it is time to close the border with NSW where there are no clusters that have not been controlled. The R0 of 0.94 after the restrictions were substantially lifted after 1 May and which was so close to the epidemic threshold of 1 was needed to allow the economy to survive. But it also meant that Australia was skating on thin ice; or playing with matches on a hot windy summers day. A local cluster could easily escape control and become locally epidemic. 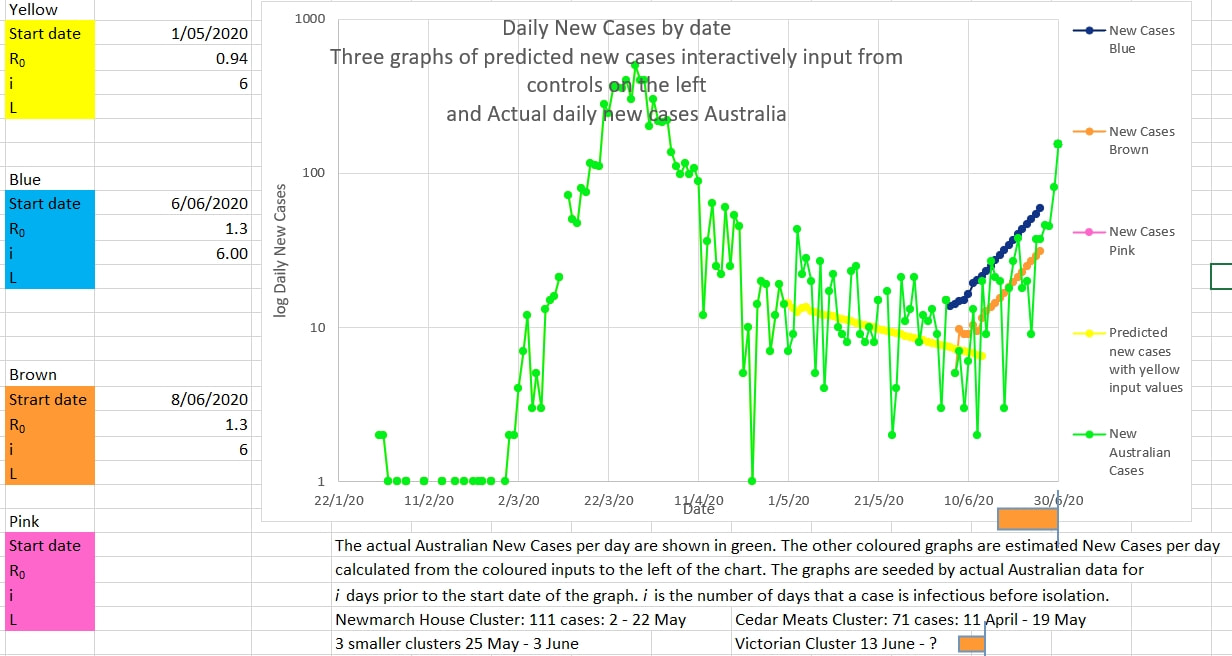 The graph below shows the R8 (an estimate of R0 from cases over the previous 8 days) in orange and the actual Australian new cases each day in blue. The estimated R0 exceeded 1 on the 16 June and has been substantially over 1 ever since. Locally Victoria is in the about the same position as Australia was on the 20 March 2020 when effective restrictions were put in place. Previous experience has shown that communities recover better with early comprehensive restrictions than they do with slow responsive measures (the latter probably from a mixture of denial and political expediency). It is probably true that with epidemics now is always the best time to act. 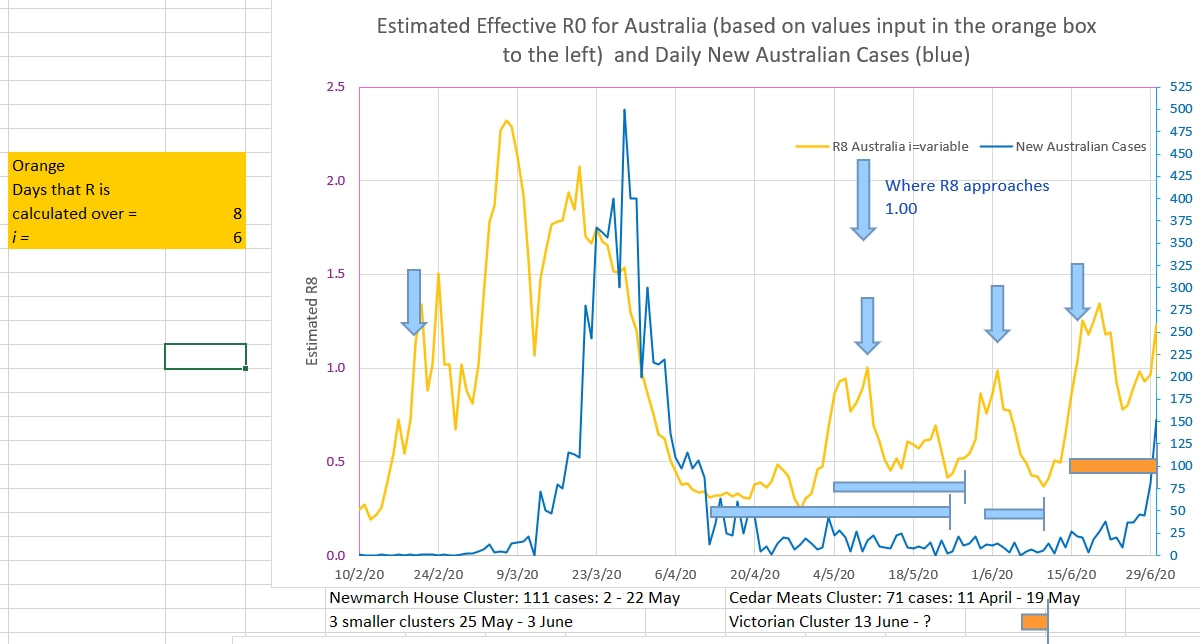
0 Comments
|
AuthorDr Michael Cole FRACP LLB Archives
September 2021
Categories |
 RSS Feed